Visualization Using SageMaker geospatial capabilities
Note
Amazon SageMaker geospatial capabilities will no longer be open to new customers starting on 7/30/26. Offboard any
previously saved jobs to Amazon S3 by using the ExportEarthObservationJob
Using the visualization functionalities provided by Amazon SageMaker geospatial you can visualize geospatial data,
the inputs to your EOJ or VEJ jobs as well as the outputs exported from your Amazon S3 bucket.
The visualization tool is powered by Foursquare Studio
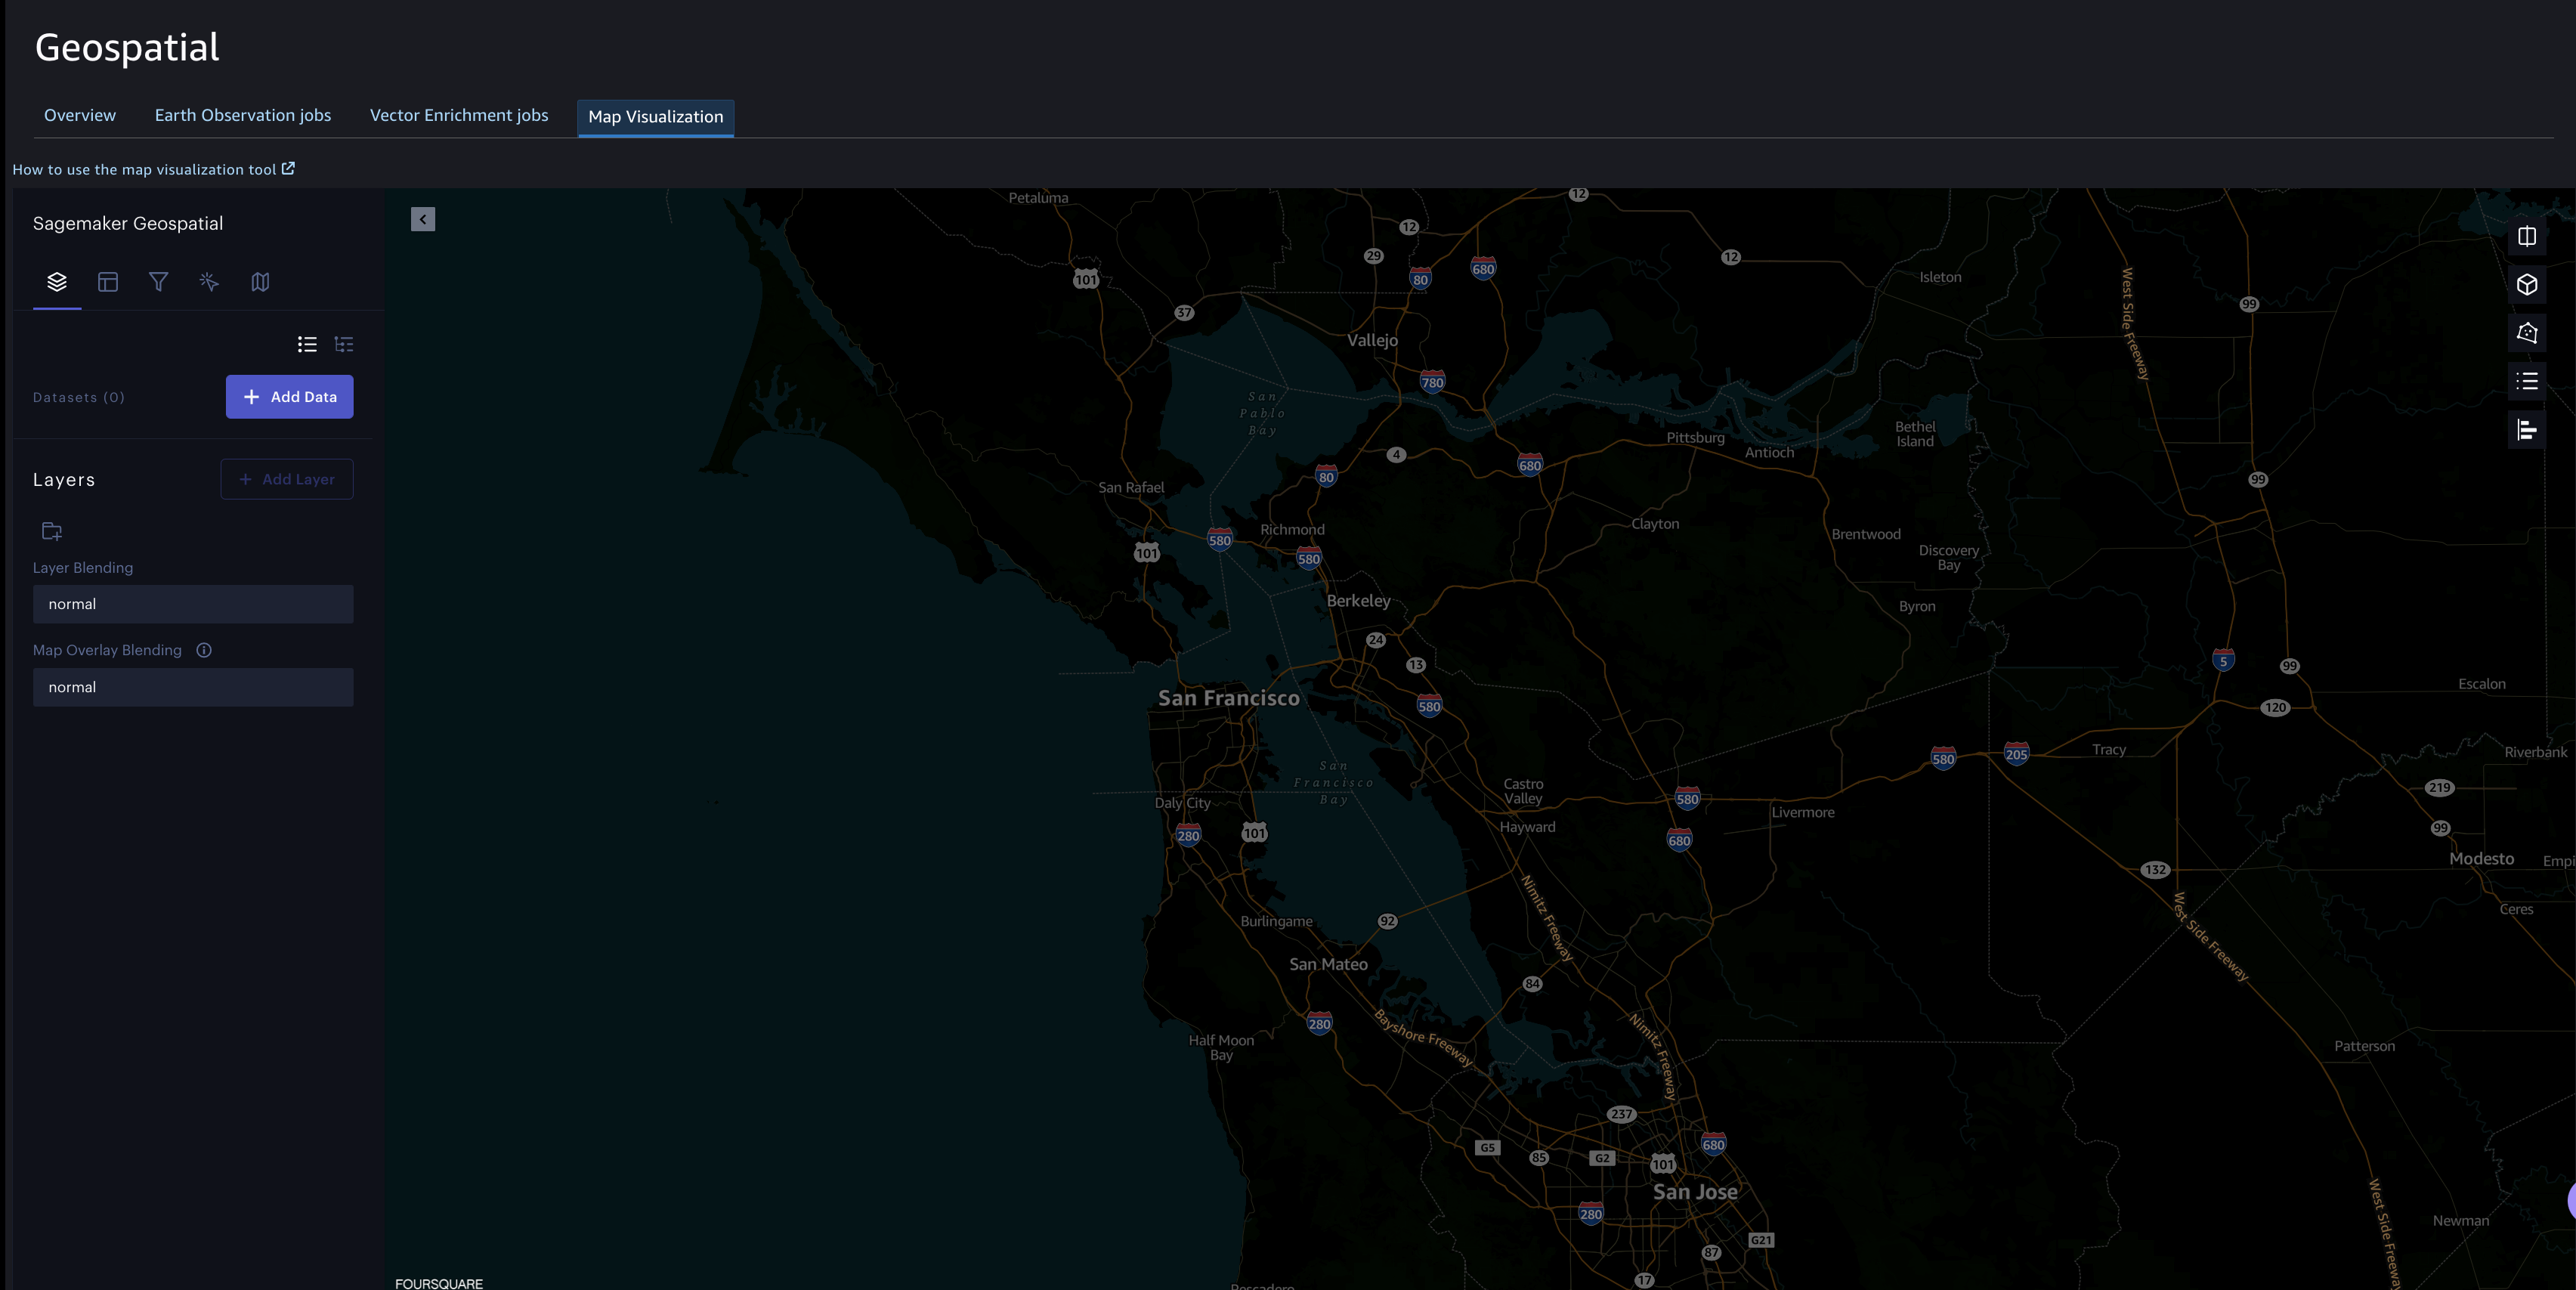
You can use the left navigation panel to add data, layers, filters, and columns. You can also make modifications to how you interact with the map.
Dataset
The source of data used for visualization is called a Dataset. To add data for visualization, choose Add Data in the left navigation panel. You can either upload the data from your Amazon S3 bucket or your local machine. The data formats supported are CSV, JSON and GeoJSON. You can add multiple datasets to your map. After you upload the dataset, you can see it loaded on the map screen.
Layers
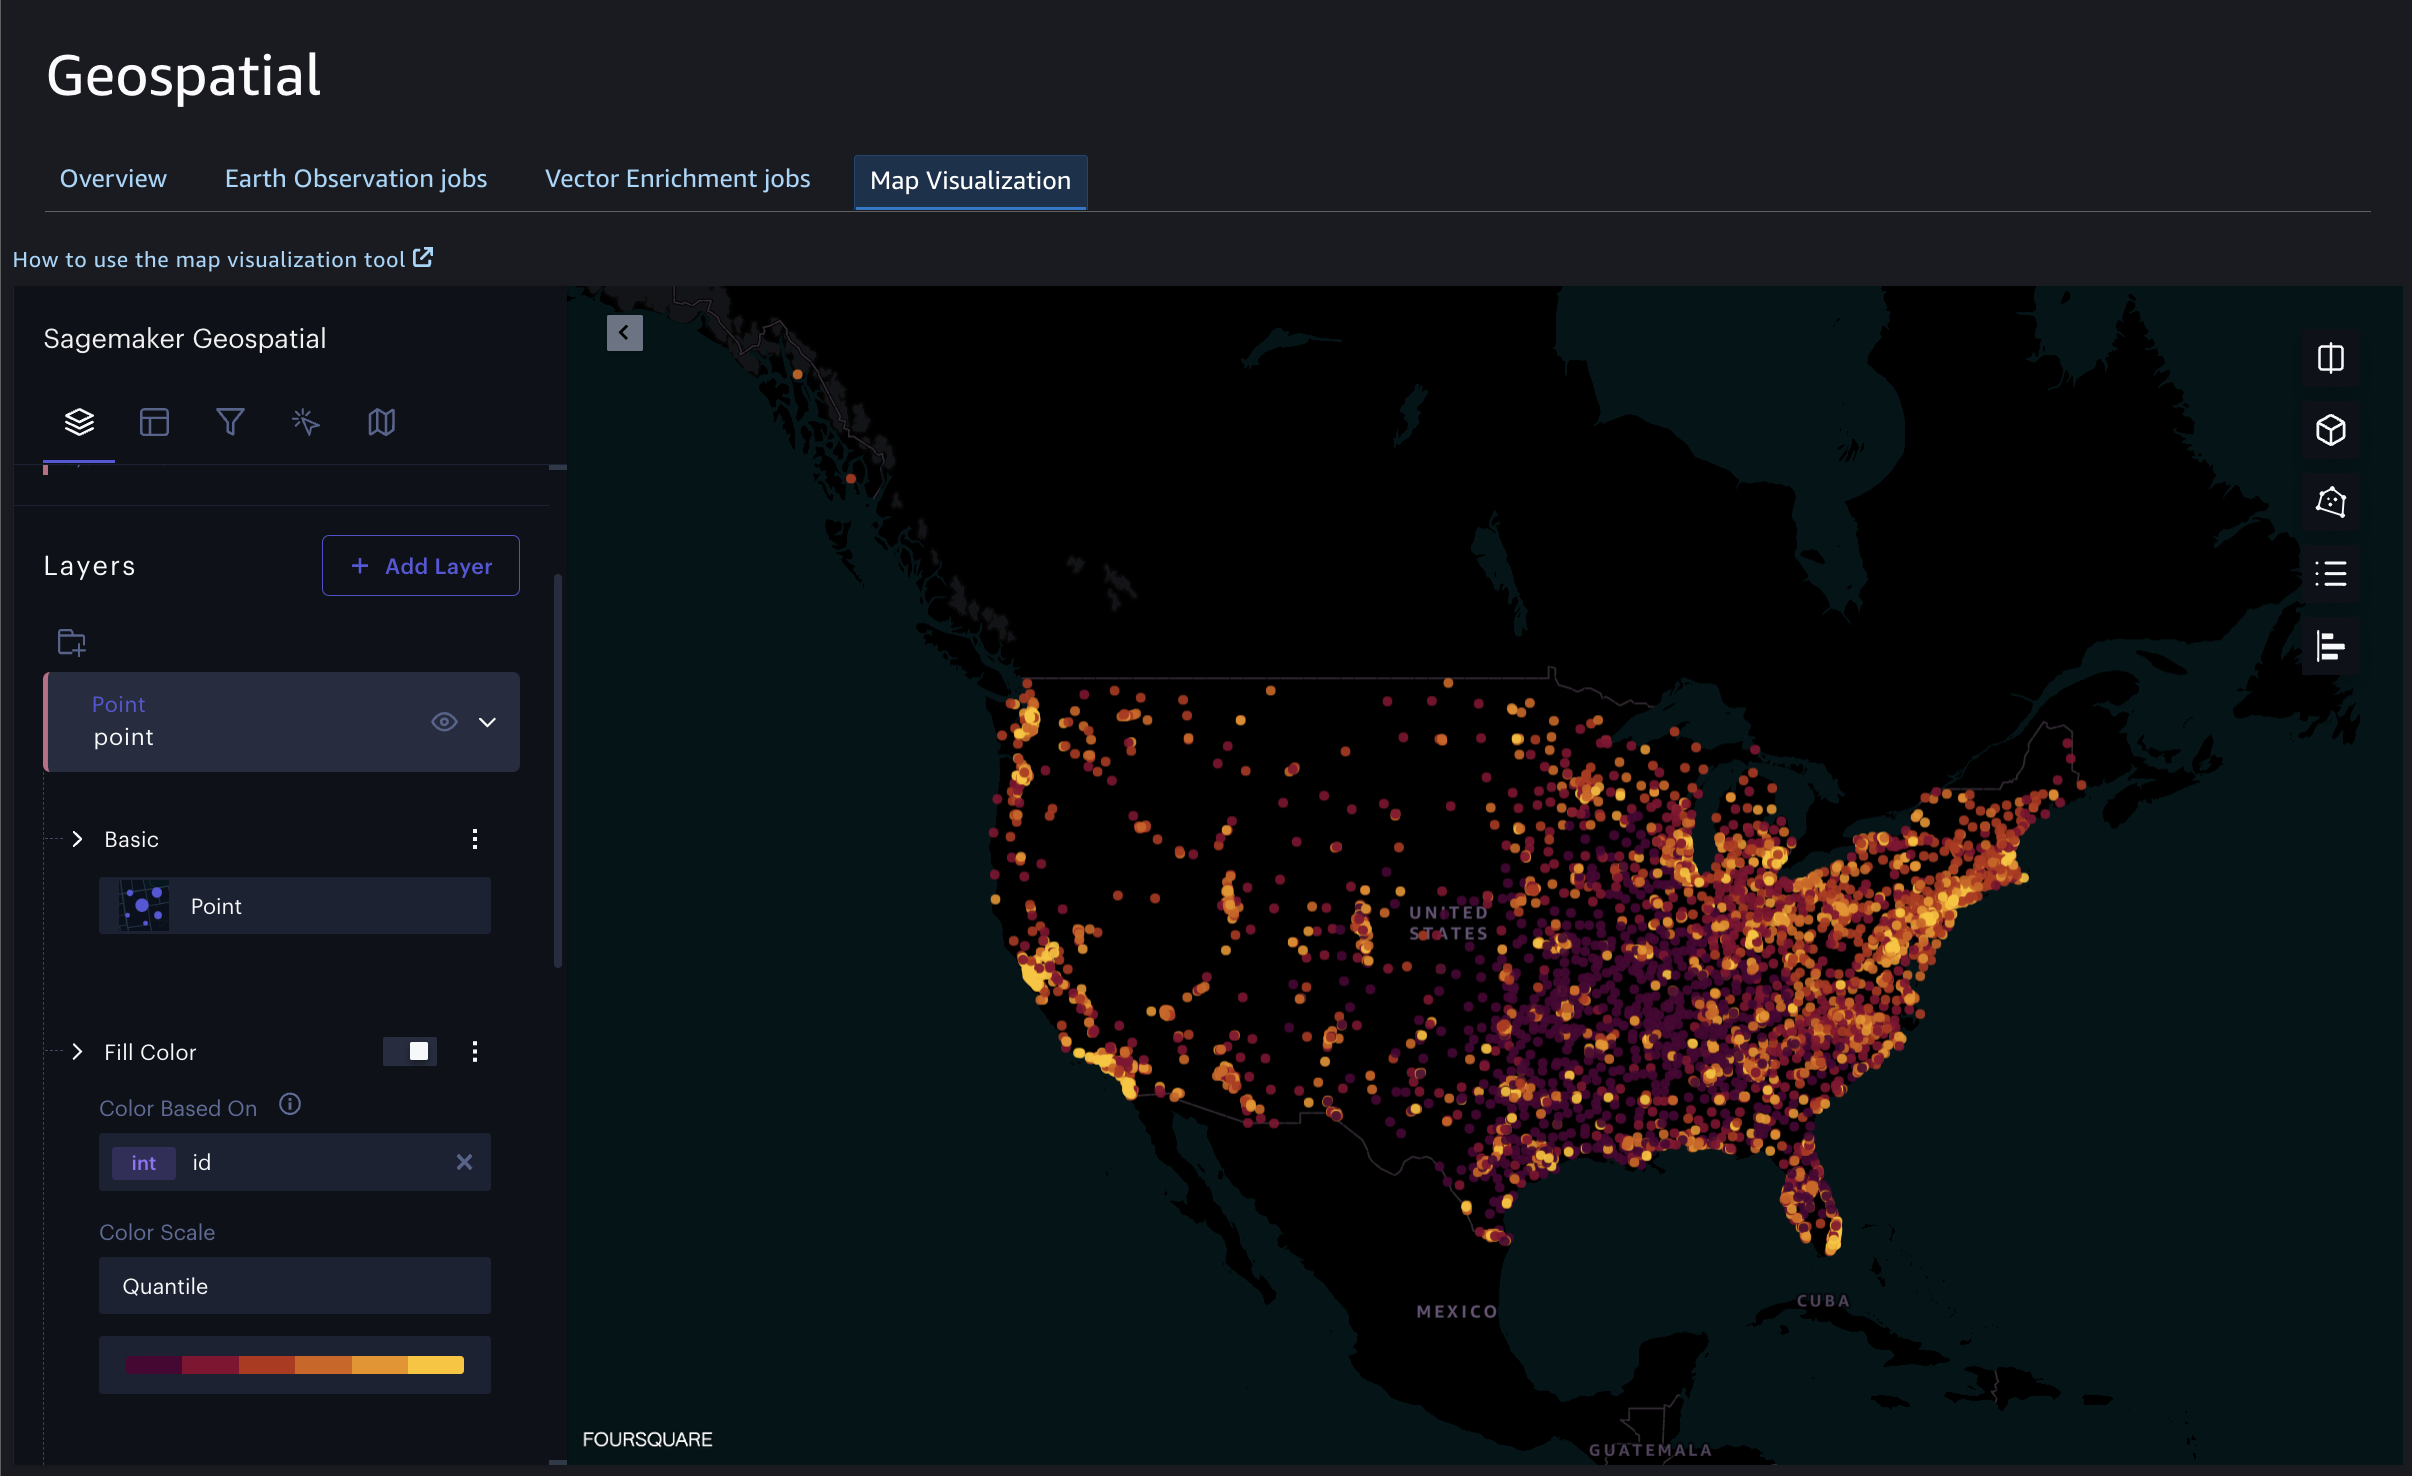
In the layer panel, a layer is created and populated automatically when you add a dataset. If your map consists of more than one dataset, you can select which dataset belongs to a layer. You can create new layers and group them. SageMaker SageMaker geospatial capabilities support various layer types, including point, arc, icon, and polygon.
You can choose any data point in a layer to have an Outline. You can also further customize the data points. For example, you can choose the layer type as Point and then Fill Color based on any column of your dataset. You can also change the radius of the points.
The following image shows the layers panel supported by SageMaker geospatial capabilities.
Columns
You can view the columns present in your dataset by using the Columns tab in the left navigation panel.
Filters
You can use filters to limit the data points that display on the map.
Interactions
In the Interactions panel, you can customize how you interact with the map. For example, you can choose what metrics to display when you hover the tooltip over a data point.
Base map
Currently, SageMaker AI only supports the Amazon Dark base map.
Split Map Modes
You can have a Single Map, Dual Maps or Swipe Maps. With Dual Maps, you can compare the same map side-by-side using different layers. Use Swipe Maps to overlay two maps on each other and use the sliding separator to compare them. You can choose the split map mode by choosing the Split Mode button on the top right corner of your map.
Legends for EOJ in the SageMaker geospatial UI
The output visualization of an EOJ depends on the operation you choose to create it. The legend is based on the default color scale. You can view the legend by choosing the Show legend button on the top right corner of your map.
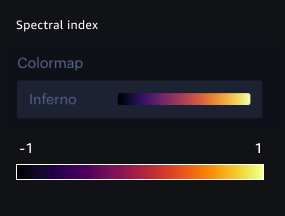
Spectral Index
When you visualize the output for an EOJ that uses the spectral index operation, you can map the category based on the color from the legend as shown.
Cloud Masking
When you visualize the output for an EOJ that uses the cloud masking operation, you can map the category based on the color from the legend as shown.

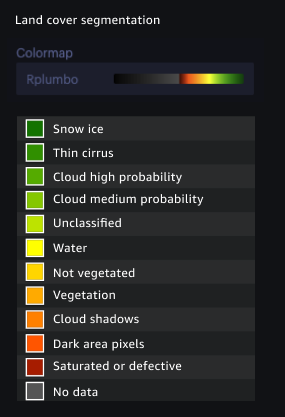
Land Cover Segmentation
When you visualize the output for an EOJ that uses the Land Cover Segmentation operation, you can map the category based on the color from the legend as shown.