SageMaker AI Insights dashboard
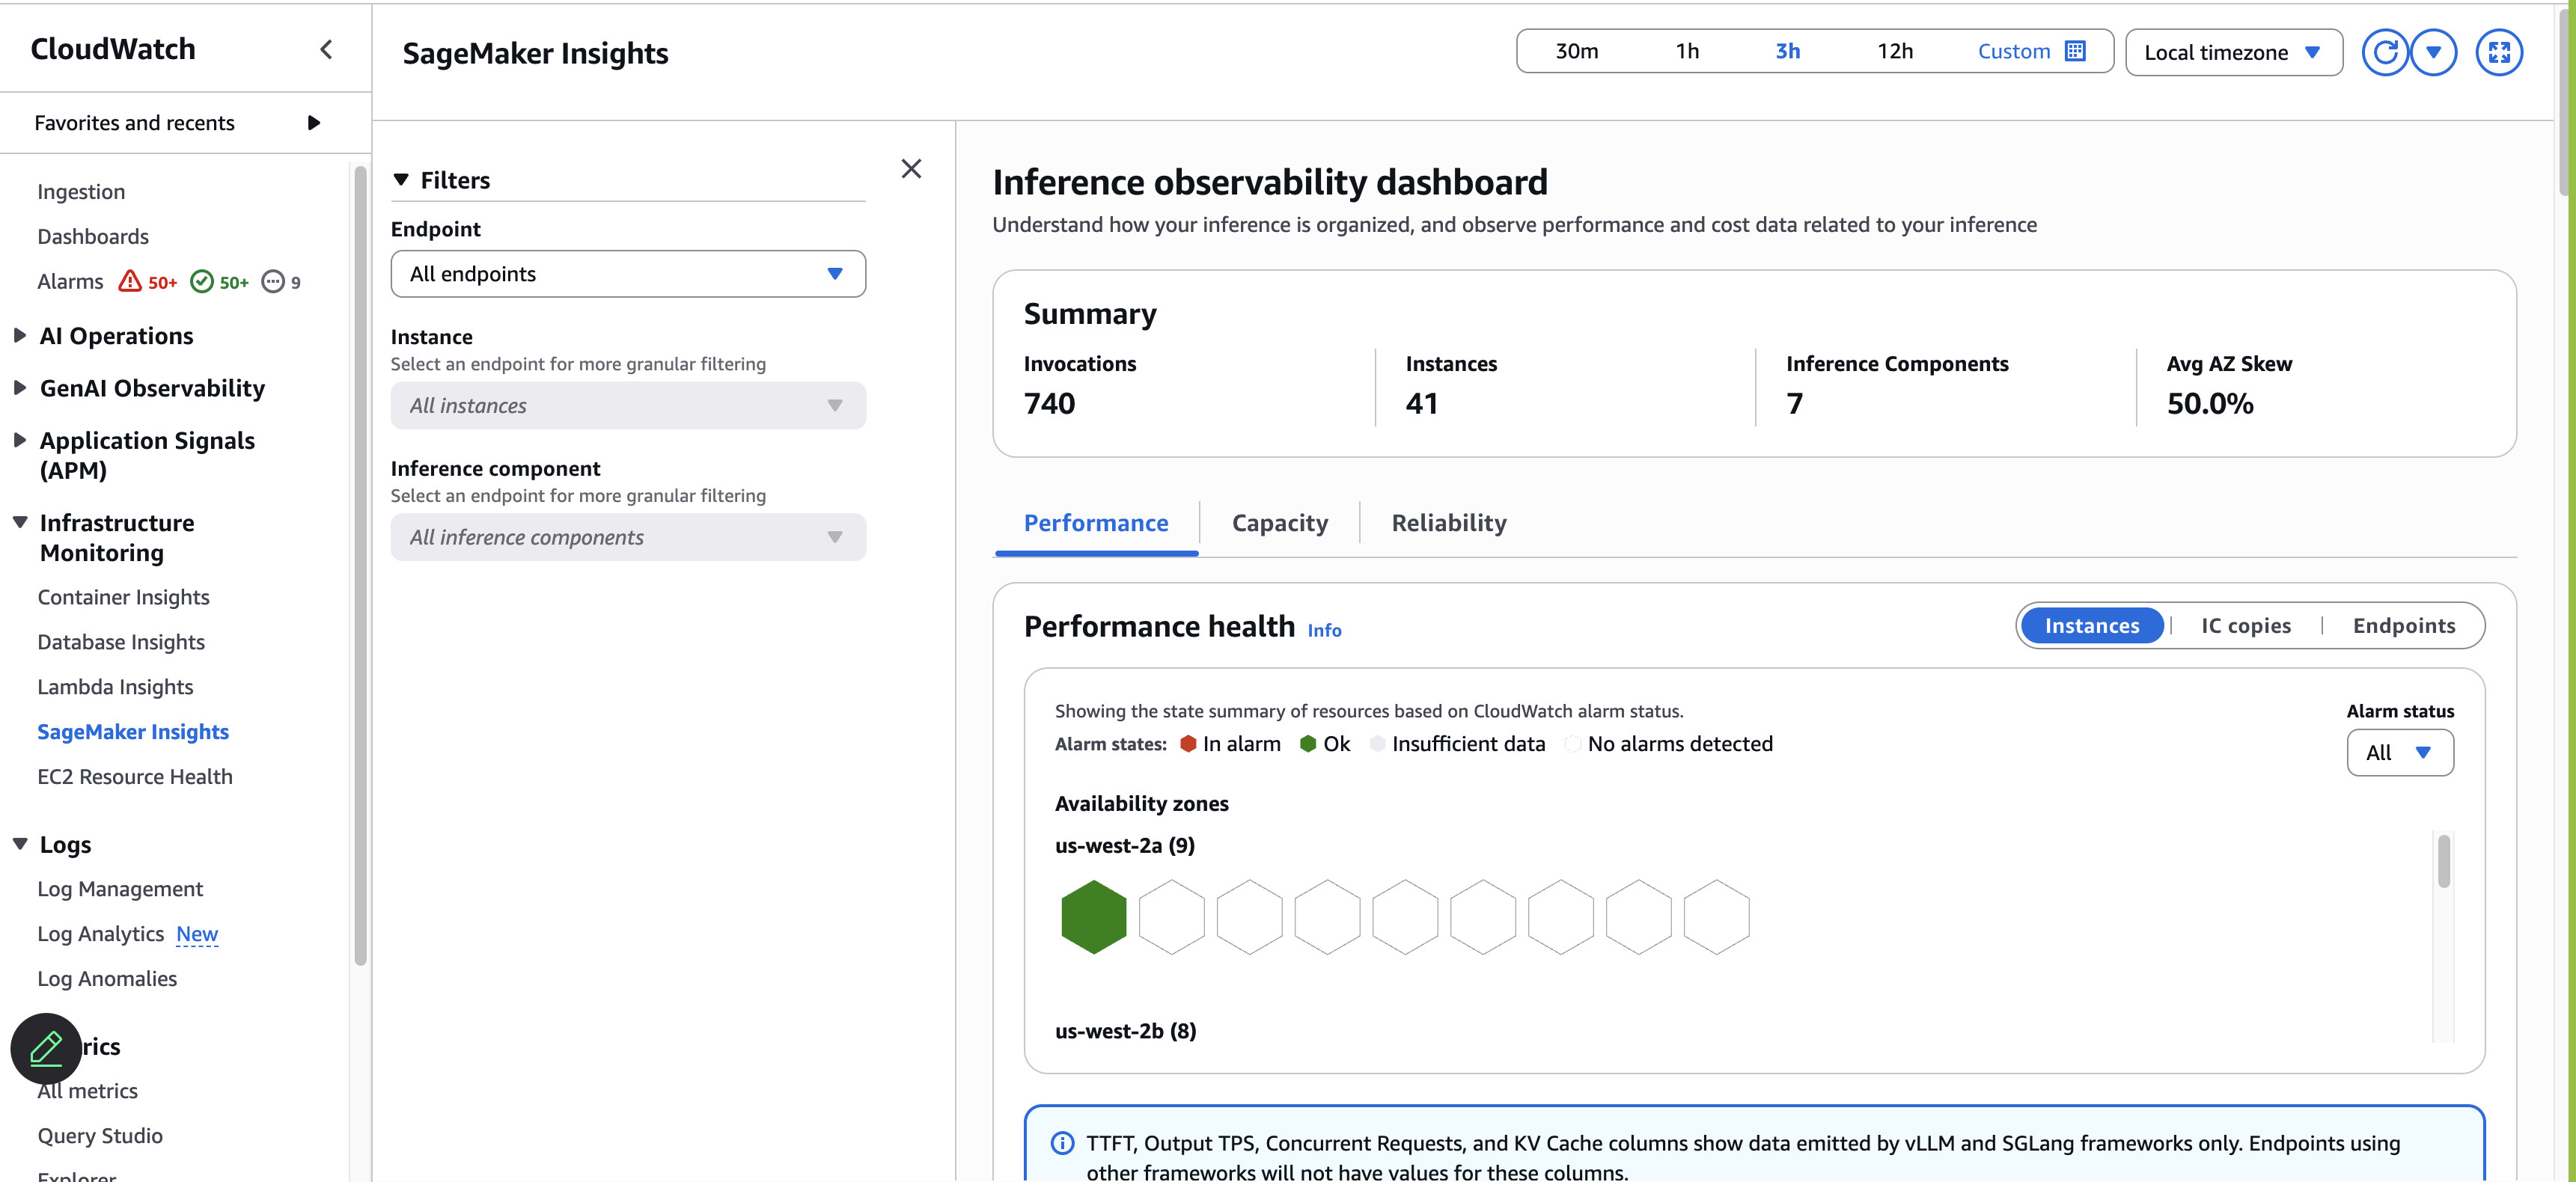
Use CloudWatch SageMaker AI Insights to monitor and troubleshoot SageMaker AI inference endpoints at scale. The dashboard displays curated metrics and visualizations across three views — Performance, Capacity, and Reliability — so you can quickly identify issues, optimize resource utilization, and ensure high availability across your endpoints.
SageMaker AI Insights supports monitoring across endpoint types (single-model endpoints and inference component-based endpoints) and inference frameworks (vLLM, SGLang).
Accessing the dashboard
You can access the SageMaker AI Insights dashboard from multiple locations in the console:
From the Endpoints list page: Click View in SageMaker Insights to open the dashboard at the fleet level with no filters applied.
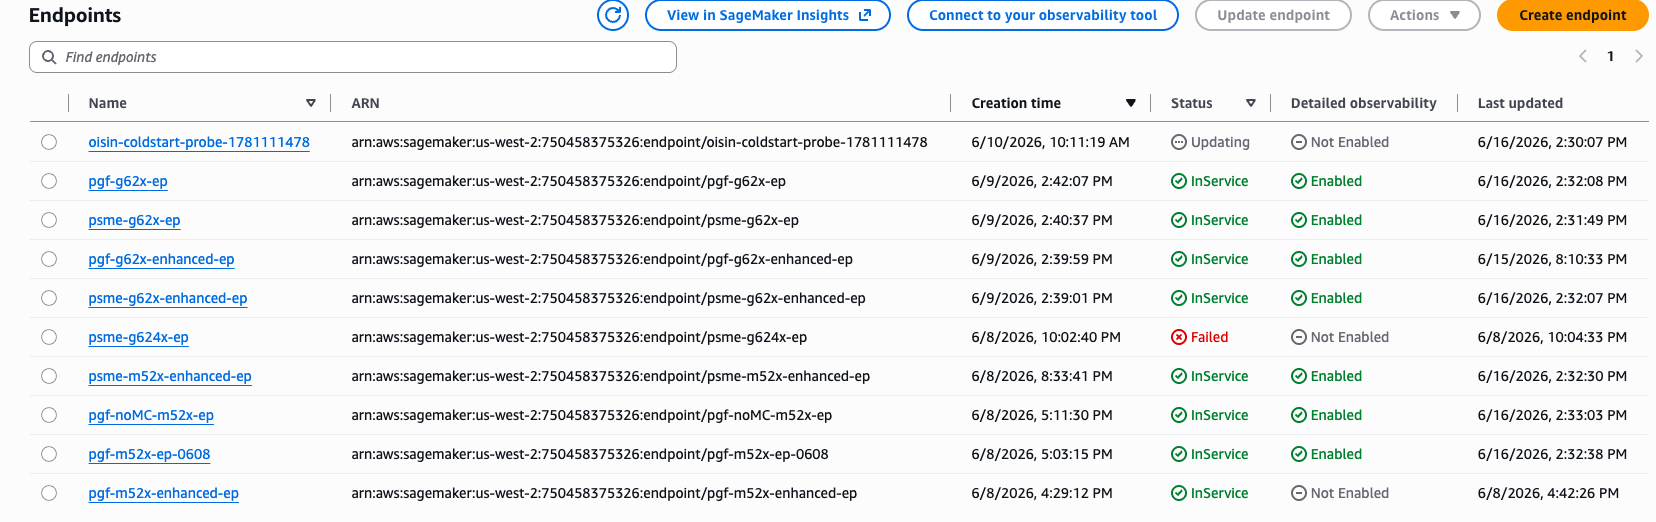
From the Endpoint detail page: Click View in SageMaker Insights to open the dashboard filtered to that endpoint.

From the Inference Component detail page: Click View in SageMaker Insights to open the dashboard filtered to that endpoint and inference component.
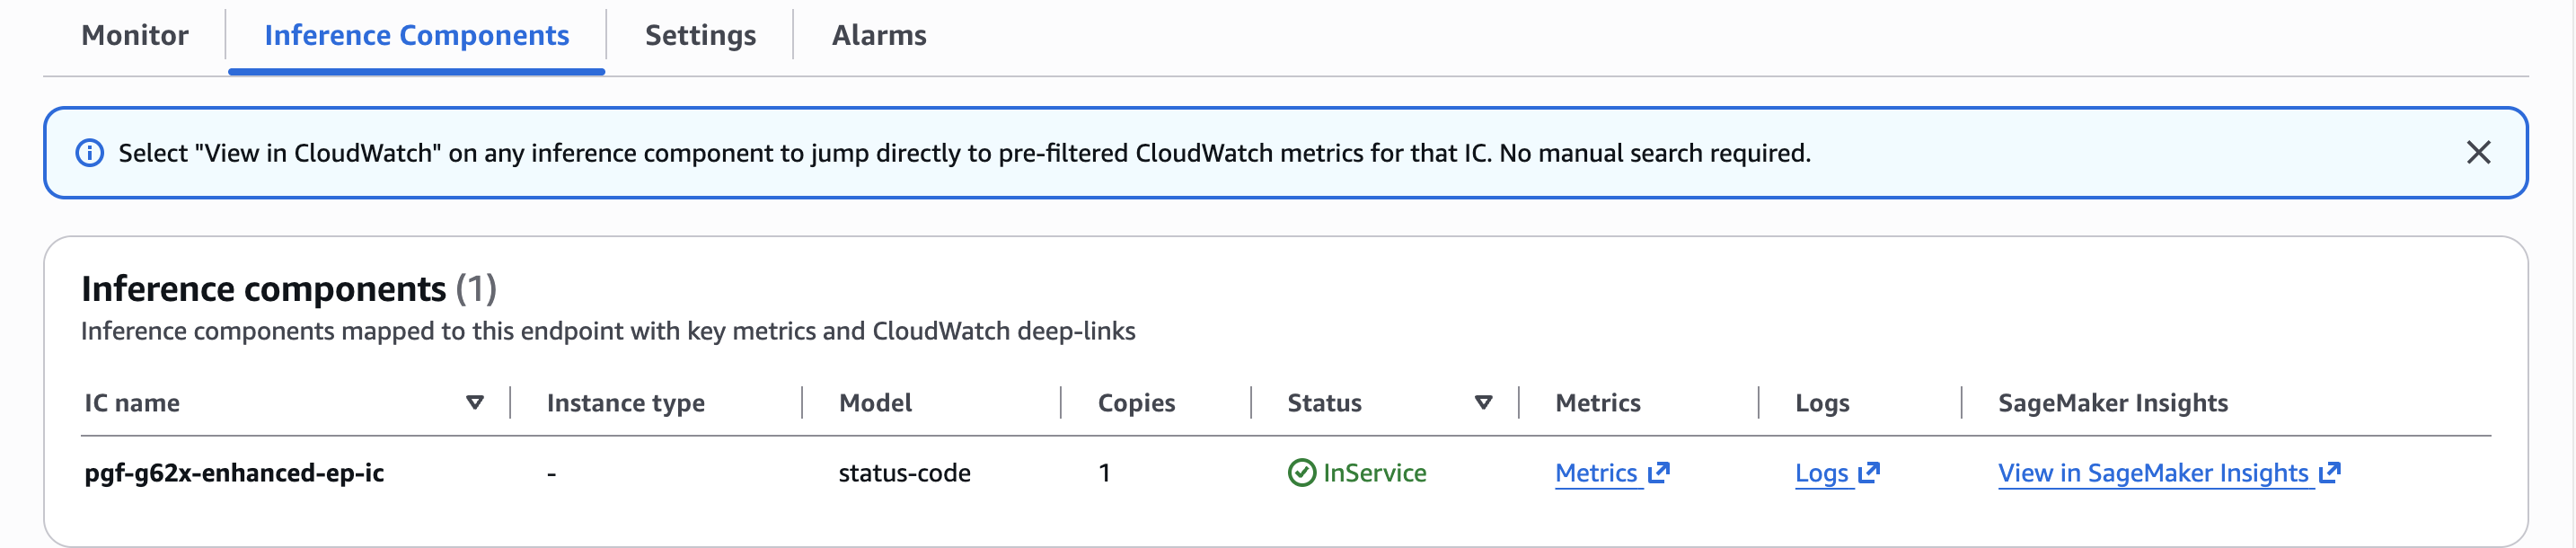
Direct navigation: Amazon CloudWatch → Infrastructure Monitoring → SageMaker AI Insights
Dashboard tabs
The dashboard is organized into three tabs:
-
Performance – Performance health honeycombs, instance performance table, token streaming (TTFT/ITL), token throughput, engine and request pressure, latency breakdown, and traffic distribution.
-
Capacity – Capacity health honeycombs, instance capacity table, and fleet utilization (CPU, GPU, GPU Memory, Memory, Disk).
-
Reliability – Availability zone distribution, scaling event timeline, cold start anatomy, and ICE diagnostics.
For detailed information about the widgets and visualizations in each tab, see
SageMaker AI
Insights Dashboard