Services or capabilities described in Amazon Web Services documentation might vary by Region. To see the differences applicable to the China Regions,
see Getting Started with Amazon Web Services in China
(PDF).
View the details of a pipeline run
You can review the details of a particular SageMaker AI pipeline run. This can help you:
-
Identify and resolve problems that may have occurred during the run, such as failed
steps or unexpected errors.
-
Compare the results of different pipeline executions to understand how changes in
input data or parameters impact the overall workflow.
-
Identify bottlenecks and opportunities for optimization.
To view the details of a pipeline run, complete the following steps based on whether you
use Studio or Studio Classic.
- Studio
-
-
Open the SageMaker Studio console by following the instructions in Launch
Amazon SageMaker Studio.
-
In the left navigation pane, select Pipelines.
-
(Optional) To filter the list of pipelines by name, enter a full or partial
pipeline name in the search field.
-
Select a pipeline name to view details about the pipeline.
-
Choose the Executions tab.
-
Select the name of a pipeline execution to view. The pipeline graph for that execution appears.
-
Choose any of the pipeline steps in the graph to see step settings in the right
sidebar.
-
Choose one of the following tabs to view more pipeline details:
-
Definition — The pipeline graph, including all
steps.
-
Parameters – Includes the model approval
status.
-
Details – The metadata associated with the
pipeline, such as tags, the pipeline Amazon Resource Name (ARN), and role ARN.
You can also edit the pipeline description from this page.
- Studio Classic
-
-
Sign in to Amazon SageMaker Studio Classic. For more information, see Launch Amazon SageMaker Studio Classic.
-
In the Studio Classic sidebar, choose the Home icon (
 ).
).
-
Select Pipelines from the menu.
-
To narrow the list of pipelines by name, enter a full or partial pipeline name
in the search field.
-
Select a pipeline name. The pipeline's Executions page
opens.
-
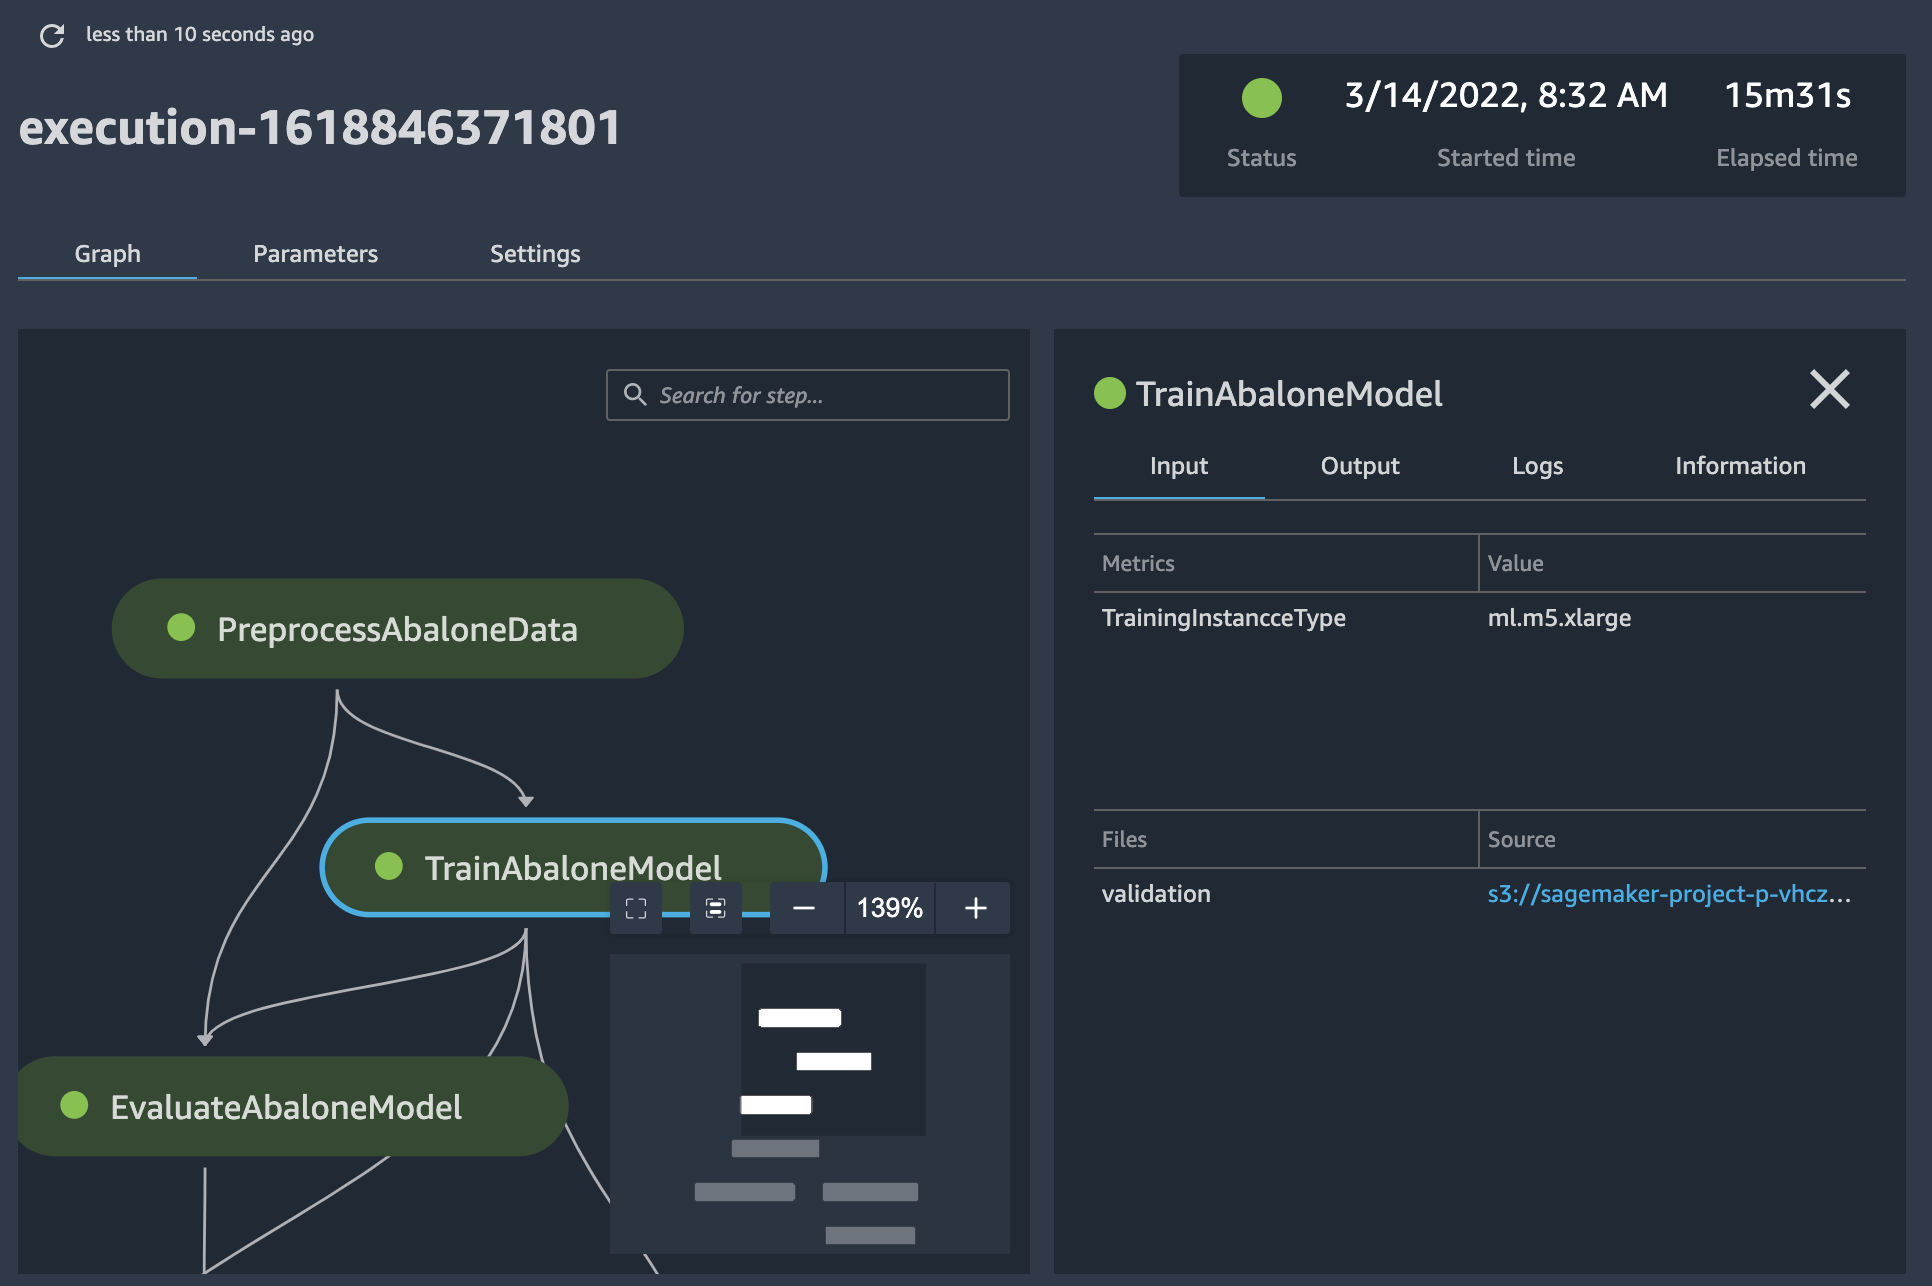
In the Executions page, select an execution name to view
details about the execution. The execution details tab opens and displays a graph of
the steps in the pipeline.
-
To search for a step by name, type characters that match a step name in the
search field. Use the resizing icons on the lower-right side of the graph to zoom in
and out of the graph, fit the graph to screen, and expand the graph to full screen.
To focus on a specific part of the graph, you can select a blank area of the graph
and drag the graph to center on that area.
-
Choose one of the pipeline steps in the graph to see details about the step. In
the preceding screenshot, a training step is chosen and displays the following
tabs:
-
Input – The training inputs. If an input source
is from Amazon Simple Storage Service (Amazon S3), choose the link to view the file in the Amazon S3
console.
-
Output – The training outputs, such as metrics,
charts, files, and evaluation outcome. The graphs are produced using the Tracker APIs.
-
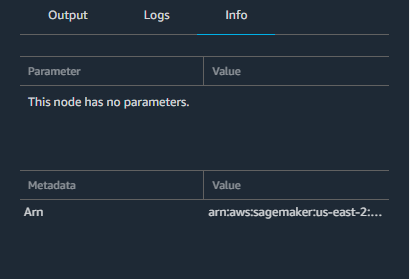
Logs – The Amazon CloudWatch logs produced by the
step.
-
Info – The parameters and metadata associated
with the step.