Verification of Amazon Data Provider for SAP in SAP system monitoring
The Amazon Data Provider for SAP exposes Amazon-specific metrics through an XML page at http://localhost:8888/vhostmd of the given system.
This section explains which metrics get exposed to the SAP system and how you can access them for SAP system monitoring.
Checking Metrics with the SAP Operating System Collector (SAPOSCOL)
The information provided by the Amazon Data Provider for SAP is read by the SAP Operating System Collector (SAPOSCOL
-
Open a Windows command shell and direct the shell to the directory
C:\Program Files\SAP\hostctrl\exe. Startsaposcol.exewith the-doption.Starting SAPOSCOL
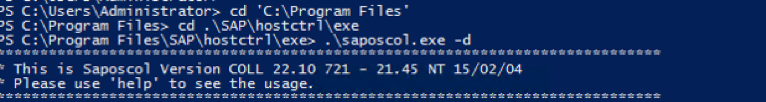
-
SAPOSCOL is now in interactive mode. Type
dump ccmand press Enter to list all values gathered. SAPOSCOL will display a lengthy list of metrics, as shown here.Metrics from SAPOSCOL
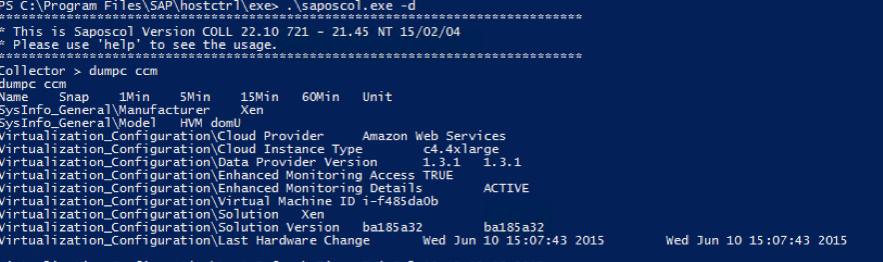
The following two metrics indicate that SAPOSCOL is collaborating successfully with the Amazon Data Provider for SAP:
-
Enhanced Monitoring Access TRUE
-
Enhanced Monitoring Details ACTIVE
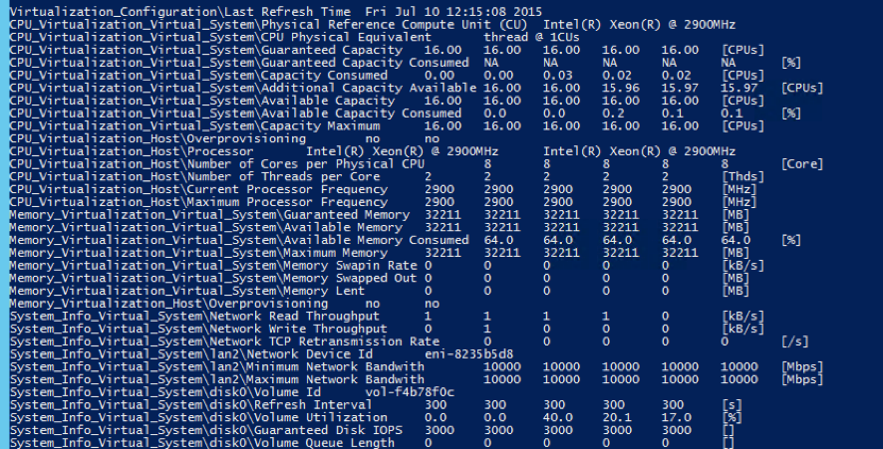
The Amazon-specific metrics start with the following strings:
+
-
Virtualization_Configuration
-
CPU_Virtualization_Virtual_System
-
Memory_Virtualization_Virtual_System
-
System_Info_Virtualization_System
-
Amazon-specific metrics
Checking Metrics with the SAP CCMS Transactions
SAPOSCOL hands the Amazon-enhanced statistics with other operating system-specific metrics to the SAP system. You can also check the Amazon-enhanced statistics in the SAP CCMS. You can enter the transaction st06 (or /nst06) in the upper-left transaction field of the SAP GUI for quick access to this data.
Note
You will need the appropriate authorizations to look up this information.
Statistics in the SAP CCMS (standard view)
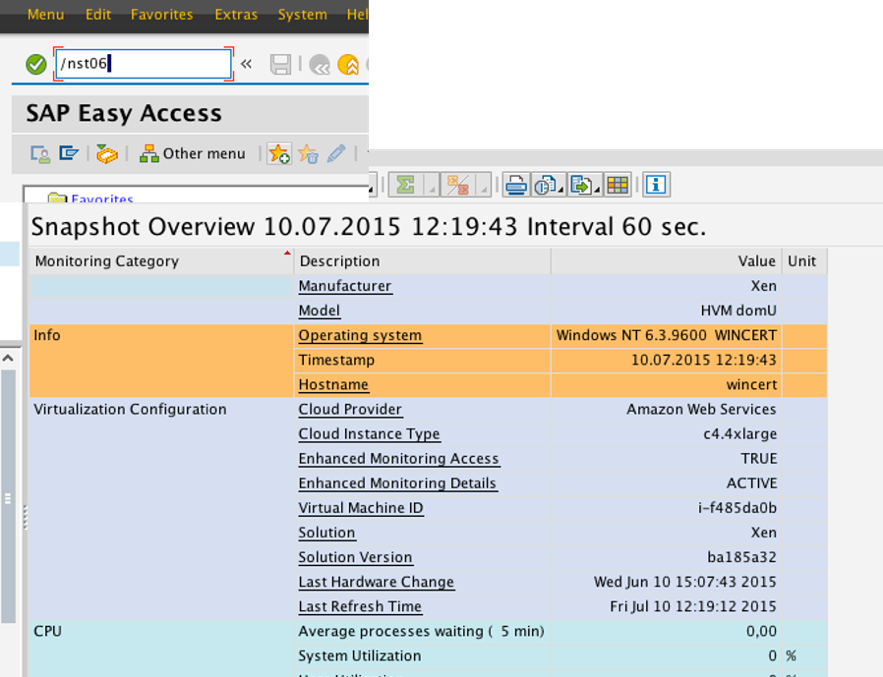
On this screen, you can verify core Amazon information such as:
-
Cloud provider
-
Instance type
-
Status of enhanced monitoring access (must be TRUE)
-
Status of enhanced monitoring details (must be ACTIVE)
-
Virtual machine identifier
Important
The enhanced Amazon metrics aren’t shown in standard view.
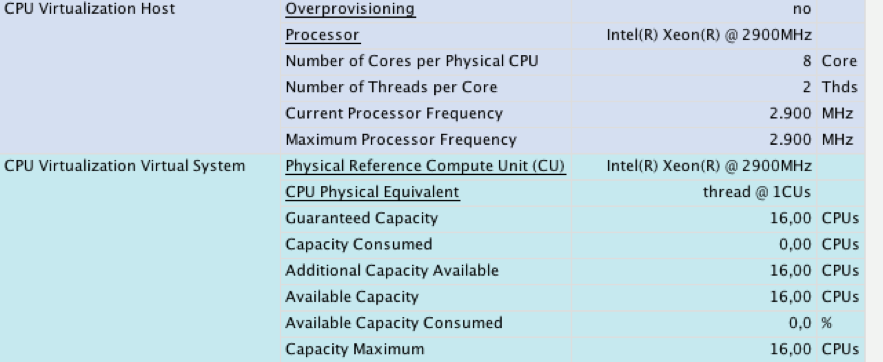
To view enhanced Amazon statistics, choose the Standard View button in the upper-left corner. It changes to Expert View and displays the enhanced Amazon statistics. The list that appears is comprehensive. It shows the processor details.
Enhanced Amazon statistics (expert view)
It also shows details about the memory subsystem (main memory and disks) and network interfaces.
Memory and networking statistics (expert view)
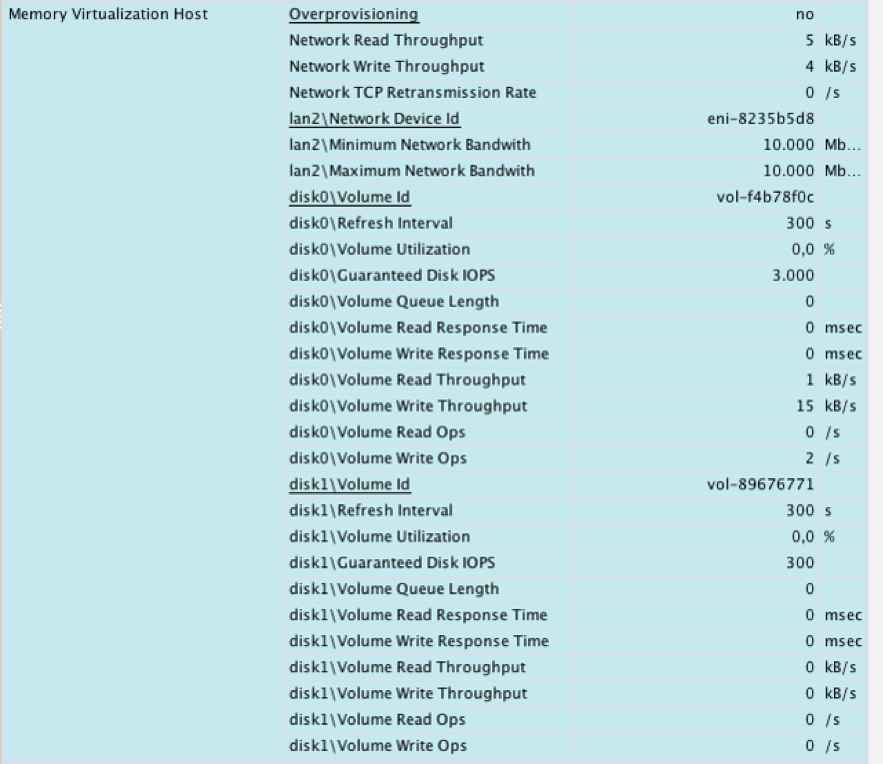
Note
The screen illustrations in Figures 37–39 were taken from SAP NetWeaver 7.4 SP08. This version shows the enhanced Amazon statistics in the Memory Virtualization section. This problem has been fixed by SAP in later versions of NetWeaver.