Active tracing in Amazon SNS
Use Amazon X-Ray to trace and analyze user requests as they pass through your Amazon SNS topics to Amazon Data Firehose, Amazon Lambda, Amazon SQS, and HTTP/S endpoint subscriptions.
With X-Ray, you get an end-to-end view of each request, allowing you to:
-
Identify what is calling your Amazon SNS topic and what services are downstream of its subscriptions.
-
Analyze latencies, such as:
-
Time spent in the Amazon SNS topic before processing.
-
Delivery times for each subscribed endpoint.
-
Important
Amazon SNS topics with numerous subscriptions may reach a size limit and not be fully traced. For information about trace document size limits, see X-ray service quotas in Amazon General Reference.
If you call an Amazon SNS API from a service that's already being traced, Amazon SNS passes the trace through, even if X-Ray tracing isn't enabled on the API.
Amazon SNS supports X-Ray tracing for both standard and FIFO topics. You can enable X-Ray for
an Amazon SNS topic by using the Amazon SNS
consoleSetTopicAttributes
API, Amazon Simple Notification Service CLI Reference, or Amazon CloudFormation
To learn more about using Amazon SNS with X-Ray, see Amazon SNS and Amazon X-Ray in the Amazon X-Ray Developer Guide.
Active tracing permissions
When using the Amazon SNS console, Amazon SNS attempts to create the necessary permissions for the Amazon SNS topic to call X-Ray. The attempt can be rejected if you don't have sufficient permissions to use the Amazon SNS console. For more information, see Identity and access management in Amazon SNS and Example cases for Amazon SNS access control.
When using the CLI, you must manually configure the permissions. Those permissions are configured using resource policies. For more on using required permissions in X-Ray, see Amazon SNS and Amazon X-Ray.
Enabling active tracing on an Amazon SNS topic using the Amazon console
When active tracing is enabled on an Amazon SNS topic, it reads the trace ID, sends the data to the customer based on the trace ID, and propagates the trace ID to downstream services.
Sign in to the Amazon SNS console
. -
Choose a topic or create a new one. For more details on creating topics, see Creating an Amazon SNS topic.
-
On the Create topic page, in the Details section, choose a topic type: FIFO or Standard.
-
Enter a Name for the topic.
-
(Optional) Enter a Display name for the topic.
-
-
Expand Active tracing, and choose Use active tracing.
Once you've enabled X-Ray for your Amazon SNS topic, you can use the X-Ray service map to view the end-to-end traces and service maps for the topic.
Enabling active tracing on an Amazon SNS topic using the Amazon SDK
The following code example shows how to enable active tracing on an Amazon SNS topic by using the Amazon SDK for Java.
public static void enableActiveTracing(SnsClient snsClient, String topicArn) {

        try {

            SetTopicAttributesRequest request = SetTopicAttributesRequest.builder()
                .attributeName("TracingConfig")
                .attributeValue("Active")
                .topicArn(topicArn)
                .build();

            SetTopicAttributesResponse result = snsClient.setTopicAttributes(request);
            System.out.println("\n\nStatus was " + result.sdkHttpResponse().statusCode() + "\n\nTopic " + request.topicArn()
                + " updated " + request.attributeName() + " to " + request.attributeValue());

        } catch (SnsException e) {
            System.err.println(e.awsErrorDetails().errorMessage());
        }
    }
Enabling active tracing on an Amazon SNS topic using the Amazon CLI
The following code example shows how to enable active tracing on an Amazon SNS topic by using the Amazon CLI.
aws sns set-topic-attributes \
    --topic-arn arn:aws-cn:sns:us-west-2:123456789012:MyTopic \
    --attribute-name TracingConfig \
    --attribute-value Active
Enabling active tracing on an Amazon SNS topic using Amazon CloudFormation
The following Amazon CloudFormation stack shows how to enable active tracing on an Amazon SNS topic.
AWSTemplateFormatVersion: 2010-09-09
Resources:
  MyTopicResource:
    Type: 'AWS::SNS::Topic'
    Properties:
      TopicName: 'MyTopic'
      TracingConfig: 'Active'
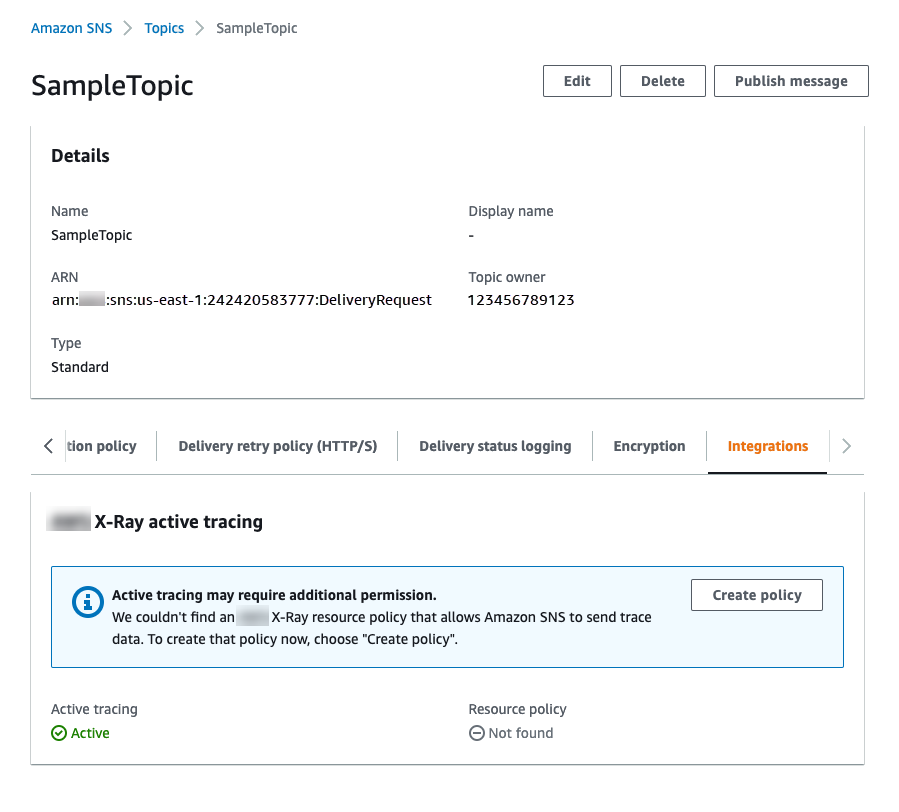
Verifying active tracing is enabled for your topic
You can use the Amazon SNS console to verify if active tracing is enabled for your topic, or when the resource policy has failed to be added.
Sign in to the Amazon SNS console
. -
In the left navigation pane, choose Topics.
-
On the Topics page, select a topic.
-
Choose the Integrations tab.
When active tracing is enabled, a green Active icon is displayed.
-
If you have enabled active tracing and you don't see that the resource policy has been added, choose Create policy to add the additional required permissions.
Testing active tracing
Sign in to the Amazon SNS console
. -
Create an Amazon SNS topic. For details on how to do this, see To create a topic using the Amazon Web Services Management Console.
-
Expand Active tracing, and choose Use active tracing.
-
Publish a message to the Amazon SNS topic. For details on how to do this, see To publish messages to Amazon SNS topics using the Amazon Web Services Management Console.
-
Use the X-Ray service map to view the end-to-end traces and service maps for the topic.
