Trace Step Functions request data in Amazon X-Ray
You can use Amazon X-Ray
With X-Ray enabled for your state machine, you can trace requests as they are executed in Step Functions, in all Amazon Regions where X-Ray is available. This gives you a detailed overview of an entire Step Functions request. Step Functions will send traces to X-Ray for state machine executions, even when a trace ID is not passed by an upstream service. You can use an X-Ray service map to view the latency of a request, including any Amazon services that are integrated with X-Ray. You can also configure sampling rules to tell X-Ray which requests to record, and at what sampling rates, according to criteria that you specify.
When X-Ray is not enabled for your state machine, and an upstream service does not pass a trace ID, Step Functions will not send traces to X-Ray for state machine executions. However, if a trace ID is passed by an upstream service, Step Functions will then send traces to X-Ray for state machine executions.
You can use Amazon X-Ray with Step Functions in regions where both are supported. See the Step Functions and X-Ray endpoints and quotas pages for information on region support for X-Ray and Step Functions.
X-Ray and Step Functions Combined Quotas
You can add data to a trace for up to seven days, and query trace data going back thirty days, the length of time that X-Ray stores trace data. Your traces will be subject to X-Ray quotas. In addition to other quotas, X-Ray provides a minimum guaranteed trace size of 100 KiB for Step Functions state machines. If more than 100 KiB of trace data is provided to X-Ray, this may result in a frozen trace. See the service quotas section of the X-Ray endpoints and quotas page for more information on other quotas for X-Ray.
Important
Step Functions doesn't support X-Ray tracing for the child workflow executions started by a Distributed Map state because it's easy to exceed the Trace document size limit for such executions.
Topics
Setup and configuration
Enable X-Ray tracing when creating a state machine
You can enable X-Ray tracing when creating a new state machine by selecting Enable X-Ray tracing on the Specify details page.
-
Open the Step Functions console
and choose Create state machine. -
On the Choose authoring method page, choose an appropriate option to create your state machine. If you choose Run a sample project, you cannot enable X-Ray tracing during the state machine creation, and you will need to enable X-Ray tracing after your state machine has been created. For more information about enabling X-Ray in an existing state machine, see Enable X-Ray in an existing state machine.
Choose Next.
-
On the Specify details page, configure your state machine.
-
Choose Enable X-Ray tracing.
Your Step Functions state machine will now send traces to X-Ray for state machine executions.
Note
If you choose to use an existing IAM role, you should ensure that X-Ray writes are allowed. For more information about the permissions that you need, see the following topic.
IAM policies using Amazon X-Ray in Step Functions
To enable X-Ray tracing, you will need an IAM policy with suitable permissions to allow tracing. If your state machine uses other integrated services, you may need additional IAM policies. See the IAM policies for your specific service integrations.
If you enable X-Ray tracing for an existing state machine you must ensure that you add a policy with sufficient permissions to enable X-Ray traces.
-
{
    "Version":"2012-10-17",
    "Statement": [
        {
            "Effect": "Allow",
            "Action": [
                "xray:PutTraceSegments",
                "xray:PutTelemetryRecords",
                "xray:GetSamplingRules",
                "xray:GetSamplingTargets"
            ],
            "Resource": [
                "*"
            ]
        }
    ]
}
Enable X-Ray in an existing state machine
To enable X-Ray in an existing state machine:
-
In the Step Functions console
, select the state machine for which you want to enable tracing. -
Choose Edit.
-
Choose Enable X-Ray tracing.
You will see a notification telling you that you that you may need to make additional changes.
Note
When you enable X-Ray for an existing state machine, you must ensure that you have an IAM policy that grants sufficient permissions for X-Ray to perform traces. You can either add one manually, or generate one. For more information, see the IAM policy section for IAM policies using Amazon X-Ray in Step Functions.
-
(Optional) Auto-generate a new role for your state machine to include X-Ray permissions.
-
Choose Save.
Configure X-Ray tracing for Step Functions
When you first run a state machine with X-Ray tracing enabled, it will use the default configuration values for X-Ray tracing. Amazon X-Ray does not collect data for every request that is sent to an application. Instead, it collects data for a statistically significant number of requests. The default is to record the first request each second, and five percent of any additional requests. One request per second is the reservoir. This ensures that at least one trace is recorded each second as long as the service is serving requests. Five percent is the rate at which additional requests beyond the reservoir size are sampled.
To avoid incurring service charges when you are getting started, the default sampling rate is conservative. You can configure X-Ray to modify the default sampling rule and configure additional rules that apply sampling based on properties of the service or request.
For example, you might want to disable sampling and trace all requests for calls that modify state or handle Amazon Web Services accounts or transactions. For high-volume read-only calls, like background polling, health checks, or connection maintenance, you can sample at a low rate and still get enough data to observe issues that occur.
To configure a sampling rule for your state machine:
-
Go to the X-Ray console
. -
Choose Sampling.
-
To create a rule, choose Create sampling rule.
To edit a rule, choose a rule's name.
To delete a rule, choose a rule and use the Actions menu to delete it.
Some parts of existing sampling rules, such as the name and priority, cannot be changed. Instead, add or clone an existing rule, make the changes you want, then use the new rule.
For detailed information on X-Ray sampling rules and how to configure the various parameters, see Configuring sampling rules in the X-Ray console.
Integrate upstream services
To integrate the execution of Step Functions workflows, such as Express, Synchronous, and Standard workflows, with an upstream service you need to set the traceHeader. This is
automatically done for you if you are using a HTTP API in API Gateway. However, if you're using a Lambda function and/or an SDK, you need to set the traceHeader on the
StartExecution or
StartSyncExecution API calls yourself.
You must specify the traceHeader format as \p{ASCII}∗. Additionally, to let Step Functions use the same trace ID, you must specify the format as
Root={TRACE_ID};Sampled={1 or 0}. If you're using a Lambda function, replace the TRACE_ID with the trace ID in your current segment and set the Sampled
field as 1 if your sampling mode is true and 0 if your sampling mode is false. Providing the trace ID in this format ensures that you'll get a complete
trace.
The following is an example written in Python to showcase how to specify the traceHeader.
state_machine = config.get_string_paramter("STATE_MACHINE_ARN")
    if (xray_recorder.current_subsegment() is not None and
        xray_recorder.current_subsegment().sampled) :
        trace_id = "Root={};Sampled=1".format(
            xray_recorder.current_subsegment().trace_id
        )
    else:
        trace_id = "Root=not enabled;Sampled=0"
    LOGGER.info("trace %s", trace_id)

    # execute it
    response = states.start_sync_execution(
        stateMachineArn=state_machine,
        input=event['body'],
        name=context.aws_request_id,
        traceHeader=trace_id
    )
    LOGGER.info(response)
X-Ray trace in header or payload
For X-Ray traces, all Amazon services use the X-Amzn-Trace-Id header from the HTTP request. Using the header is the preferred mechanism to identify a trace. StartExecution and StartSyncExecution API operations can also use traceHeader from the body of the request payload. If both sources are provided, Step Functions will use the header value (preferred) over the value in the request body.
Concepts
The X-Ray console
In the Amazon X-Ray console, you can view service maps and traces for requests that your applications serve when X-Ray is enabled for your state machine.
See Viewing the X-Ray console for information on how to access the X-Ray console for your state machine executions.
For detailed information about the X-Ray console, see the X-Ray console documentation.
Segments, subsegments, and traces
A segment records information about a request to your state machine. It contains information such as the work that your state machine performs, and may also contain subsegments with information about downstream calls.
A trace collects all the segments generated by a single request.
Sampling
To ensure efficient tracing and provide a representative sample of the requests that your application serves, X-Ray applies a sampling algorithm to determine which requests get traced. This can be changed by editing the sampling rules.
Metrics
For your state machine, X-Ray will meter invocation time, state transition time, the overall execution time of Step Functions, and variances in this execution time. This information can be accessed through the X-Ray console.
Analytics
The Amazon X-Ray Analytics console is an interactive tool for interpreting trace data. You can refine the active dataset with increasingly granular filters by clicking the graphs and the panels of metrics and fields that are associated with the current trace set. You can analyze how your state machine is performing to locate and identify performance issues.
For detailed information about X-Ray analytics, see Interacting with the Amazon X-Ray Analytics console
Step Functions service integrations and X-Ray
Some of the Amazon services that integrate with Step Functions provide integration with Amazon X-Ray by adding a tracing header to requests, running the X-Ray daemon, or making sampling decisions and uploading trace data to X-Ray. Others must be instrumented using the Amazon X-Ray SDK. A few do not yet support X-Ray integration. X-Ray integration is necessary to provide complete trace data when using a service integration with Step Functions
Native X-Ray support
Service integrations with native X-Ray support include:
-
Amazon Step Functions
Instrumentation required
Service integrations that require X-Ray instrumentation:
-
Amazon Elastic Container Service
-
Amazon Batch
-
Amazon Fargate
Client-side trace only
Other service integrations do not support X-Ray traces. However, client side traces can still be collected:
-
Amazon DynamoDB
-
Amazon EMR
-
Amazon SageMaker AI
-
Amazon CodeBuild
-
Amazon Glue
Viewing the X-Ray console
X-Ray receives data from services as segments. X-Ray groups segments that have a common request into traces. X-Ray processes the traces to generate a service graph that provides a visual representation of your application.
After you start your state machine's execution, you can view its X-Ray traces by choosing the X-Ray trace map link in the Execution details section.
After you have enabled X-Ray for your state machine, you can view tracing information for its executions in the X-Ray console.
Viewing X-Ray tracing information for Step Functions
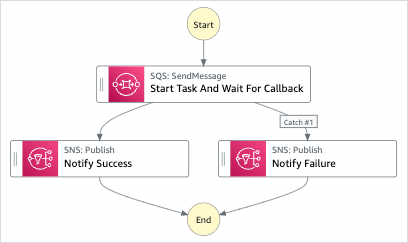
The following steps illustrate what kind of information you can see in the console after you enable X-Ray and run an execution. X-Ray traces for the Create a callback pattern example with Amazon SQS, Amazon SNS, and Lambda sample project are shown.
Traces
After an execution has finished, you can navigate to the X-Ray console, where you will see the X-Ray Traces page. This displays an overview of the service map as well as trace and segment information for your state machine.
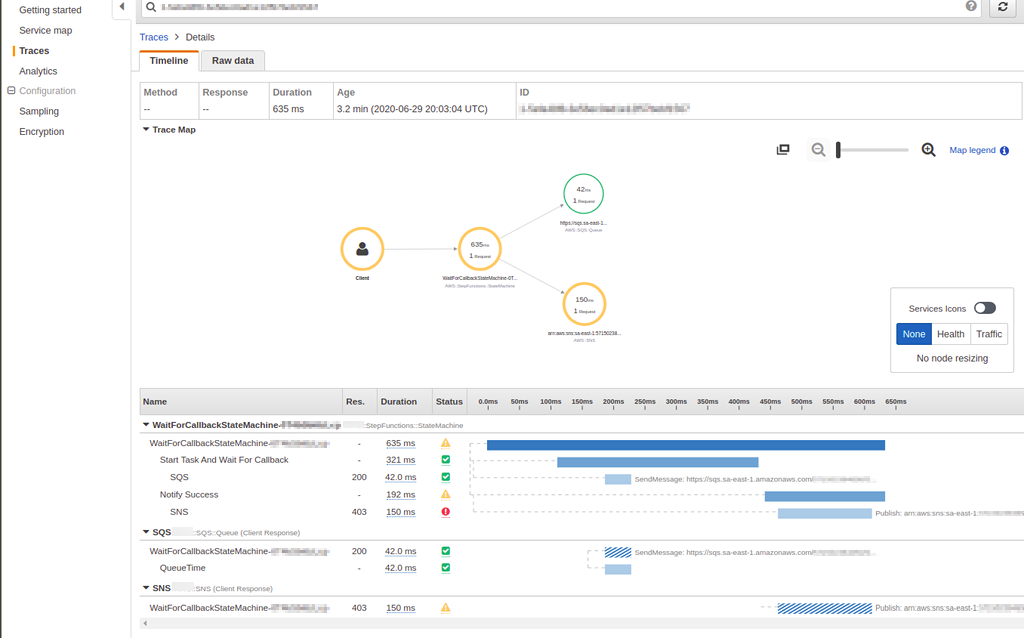
Service map
The service map in the X-Ray console helps you to identify services where errors are occurring, where there are connections with high latency, or see traces for requests that were unsuccessful.
On the trace map, you can choose a service node to view requests for that node, or an edge
between two nodes to view requests that traveled that connection. Here, the
WaitForCallBack node has been selected, and you can view additional information
about its execution and response status.
You can see how the X-Ray service map correlates to the state machine. There is a service map node for each service integration that is called by Step Functions, provided it supports X-Ray.
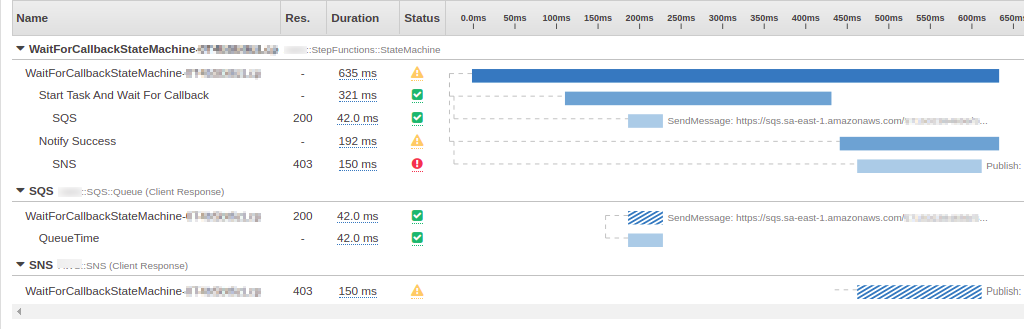
Segments and subsegments
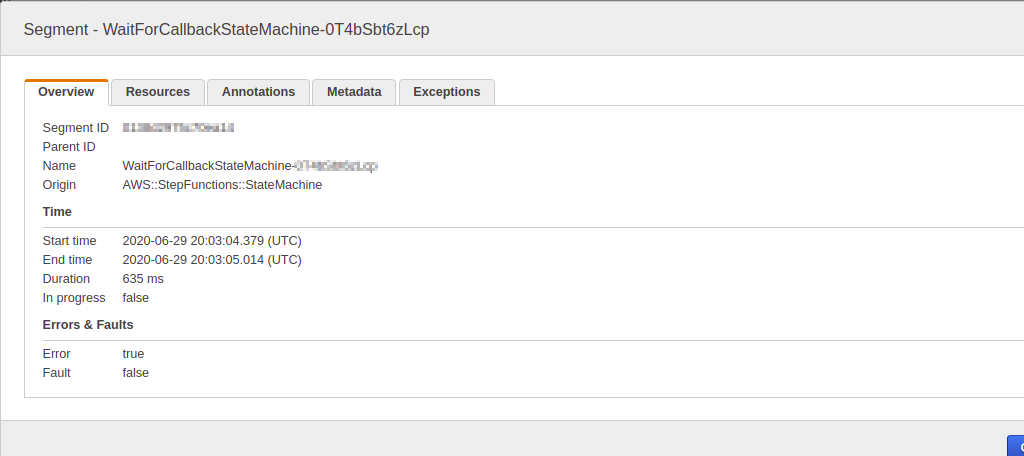
A trace is a collection of segments generated by a single request. Each segment provides the resource's name, details about the request, and details about the work done. On the Traces page, you can see the segments and, if expanded, its corresponding subsegments. You can choose a segment or subsegment to view detailed information about it.
You will be a different segment for each node on the service map.
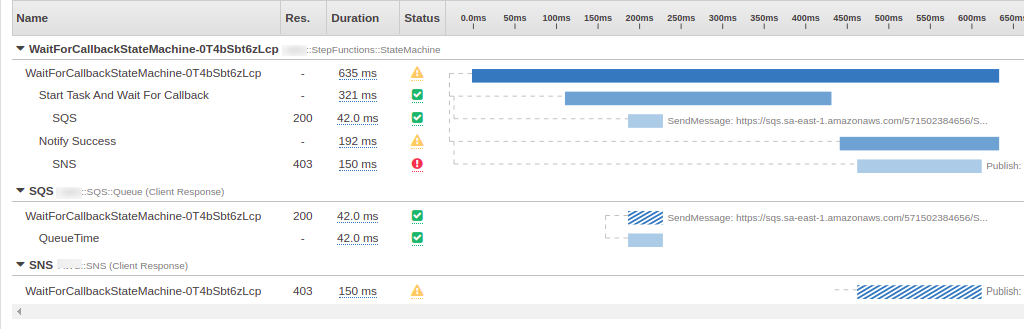
Choosing a segment provides the resource's name, details about the request, and details about the work done.
A segment can break down the data about the work done into subsegments. Choosing a subsegment shows granular timing information and details. A subsegment can contain additional details about a call to an Amazon service, an external HTTP API, or an SQL database.
Analytics
The Amazon X-Ray Analytics console is an interactive tool for interpreting trace data. You can use this to more easily understand how your state machine is performing. You can explore, analyze, and visualize traces through interactive response time and time-series graphs to help locate performance and latency issues.
You can refine the active dataset with increasingly granular filters by clicking the graphs and the panels of metrics and fields that are associated with the current trace set.
Configuration
You can configure sampling and encryption options from the X-Ray console.
-
Choose Sampling to view details about the sampling rate and configuration.
You can change the sampling rules to control the amount of data that you record, and modify sampling behavior to suit your specific requirements.
-
Choose Encryption to modify the encryption settings.
You can use the default setting, where X-Ray encrypts traces and data at rest, or, if needed, you can choose a KMS key. Standard Amazon KMS charges apply in the latter case.
What if there is no data in the trace map or service map?
If you have enabled X-Ray, but can't see any data in the X-Ray console, check that:
-
Your IAM roles are set up correctly to allow writing to X-Ray.
-
Sampling rules allow sampling of data.
-
Since there can be a short delay before newly created or modified IAM roles are applied, check the trace or service maps again after a few minutes.
-
If you see Data Not Found in the X-Ray Traces panel, check your IAM account settings
and ensure that Amazon Security Token Service is enabled for the intended region. For more information, see Activating and deactivating Amazon STS in an Amazon Web Services Region in the IAM User Guide.