Introducing a new console experience for Amazon WAF
You can now use the updated experience to access Amazon WAF functionality anywhere in the console. For more details, see Working with the console.
Viewing infrastructure layer (layer 3 or 4) event details in Shield Advanced
You can see details about an infrastructure layer event's detection, mitigation, and top contributors in the bottom section of the console page for the event. This section can include a mix of legitimate and potentially unwanted traffic, and may represent both traffic that was passed to your protected resource and traffic that was blocked by Shield mitigations.
Detection and mitigation
For an infrastructure layer (layer 3 or 4) event, the Detection and mitigation tab shows detection metrics that are based on sampled network flows and mitigation metrics that are based on traffic observed by the mitigation systems. Mitigation metrics are a more precise measurement of the traffic into your resource.
Shield automatically creates a mitigation for the protected resource types Elastic IP (EIP), Classic Load Balancer (CLB), Application Load Balancer (ALB), and Amazon Global Accelerator standard accelerator. Mitigation metrics for EIP addresses and Amazon Global Accelerator standard accelerators indicate the number of passed and dropped packets.
The following screenshot shows an example Detection and mitigation tab for an infrastructure layer event.
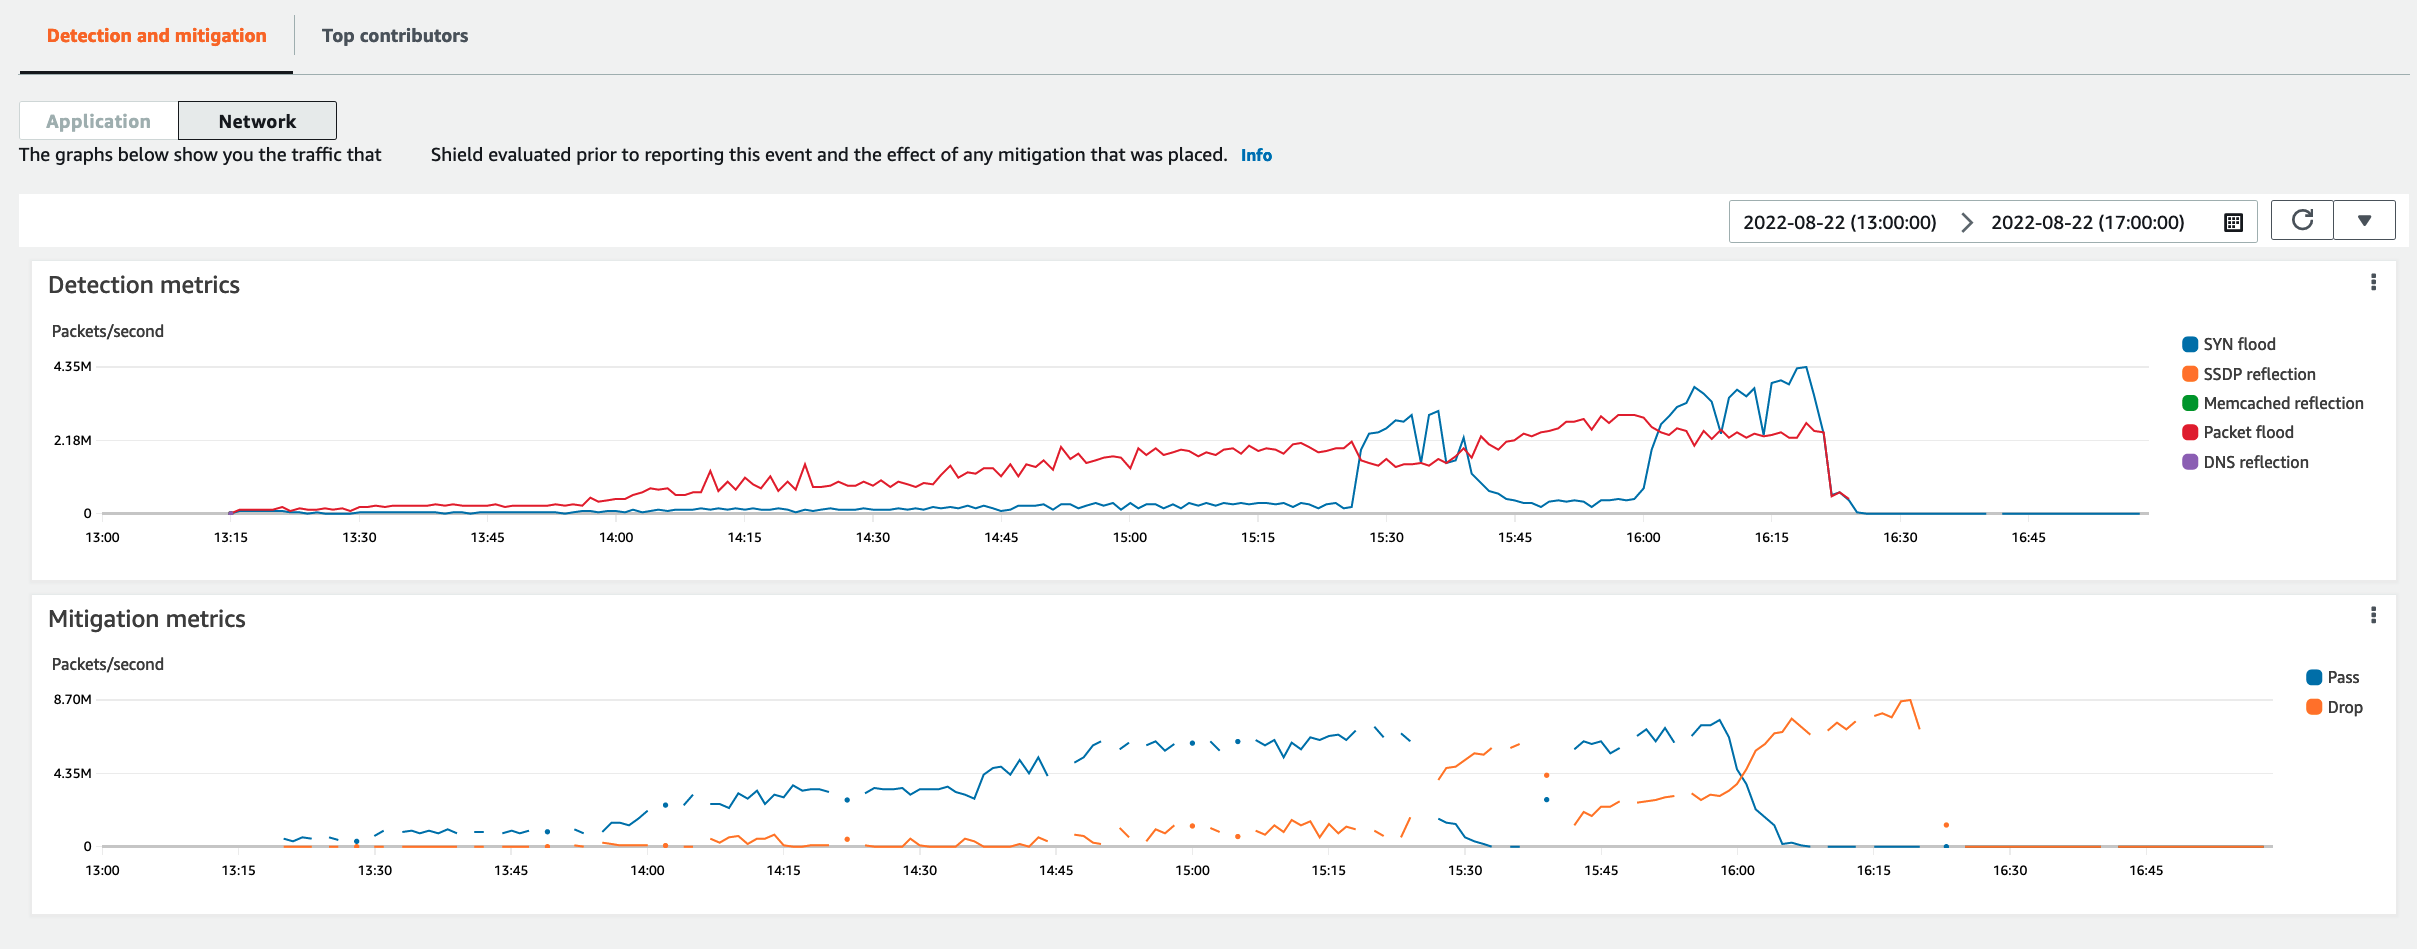
Event traffic that subsides before Shield places a mitigation isn't represented in the mitigation metrics. This can result in a difference between the traffic shown in the detection graphs and the pass and drop metrics shown in the mitigation graphs.
Top contributors
The Top contributors tab for infrastructure layer events lists metrics for up to 100 top contributors on several traffic dimensions. The details include network layer properties for any dimension where at least five significant sources of traffic could be identified. Examples of sources of traffic are source IP and source ASN.
The following screenshot shows an example Top contributors tab for an infrastructure layer event.
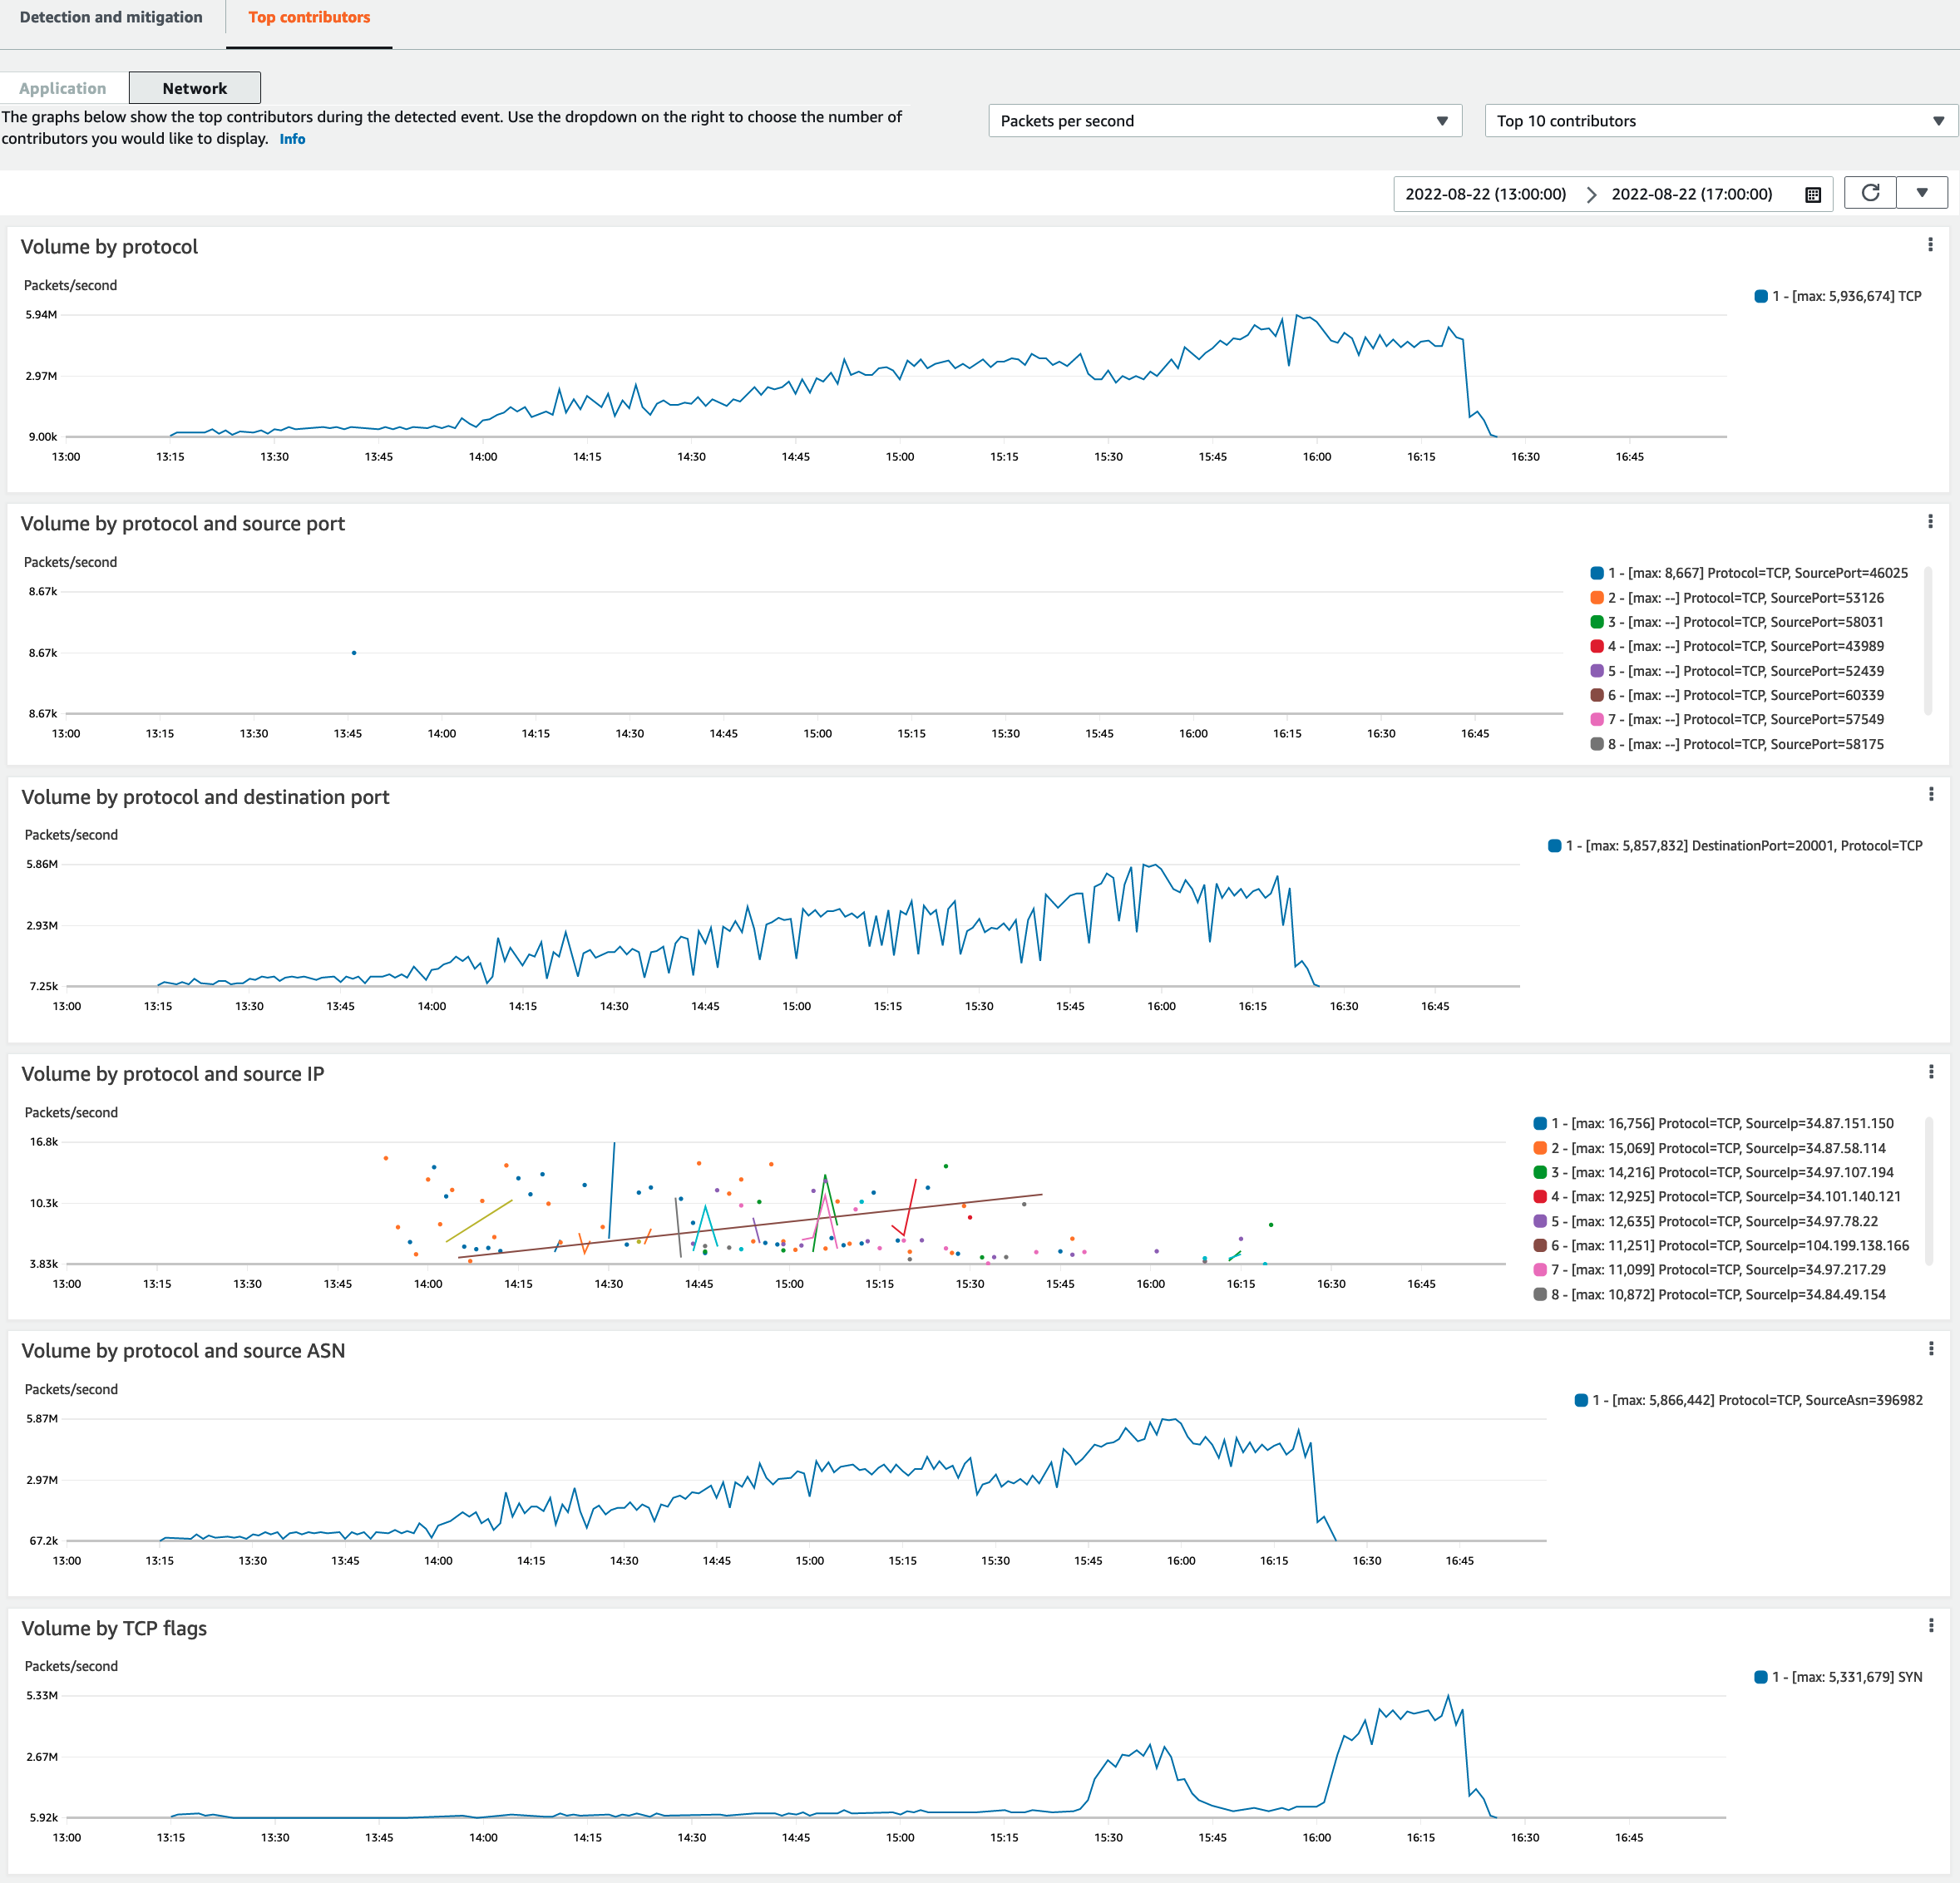
Contributor metrics are based on sampled network flows for both legitimate and potentially unwanted traffic. Larger volume events and events where the traffic sources aren't highly distributed are more likely to have identifiable top contributors. A significantly distributed attack could have any number of sources, making it hard to identify top contributors to the attack. If Shield doesn't identify any significant contributors for a specific metric or category, it displays the data as unavailable.
In an infrastructure layer DDoS attack, traffic sources might be spoofed or reflected. A spoofed source is intentionally forged by the attacker. A reflected source is the real source of detected traffic, but it's not a willing participant in the attack. For example, an attacker might generate a large, amplified flood of traffic to a target by reflecting the attack off of services on the internet that are usually legitimate. In this case, the source information might be valid while it's not the actual source of the attack. These factors can limit the viability of mitigation techniques that block sources based on packet headers.