Introducing a new console experience for Amazon WAF
You can now use the updated experience to access Amazon WAF functionality anywhere in the console. For more details, see Working with the console.
Viewing Amazon Shield global and account activity
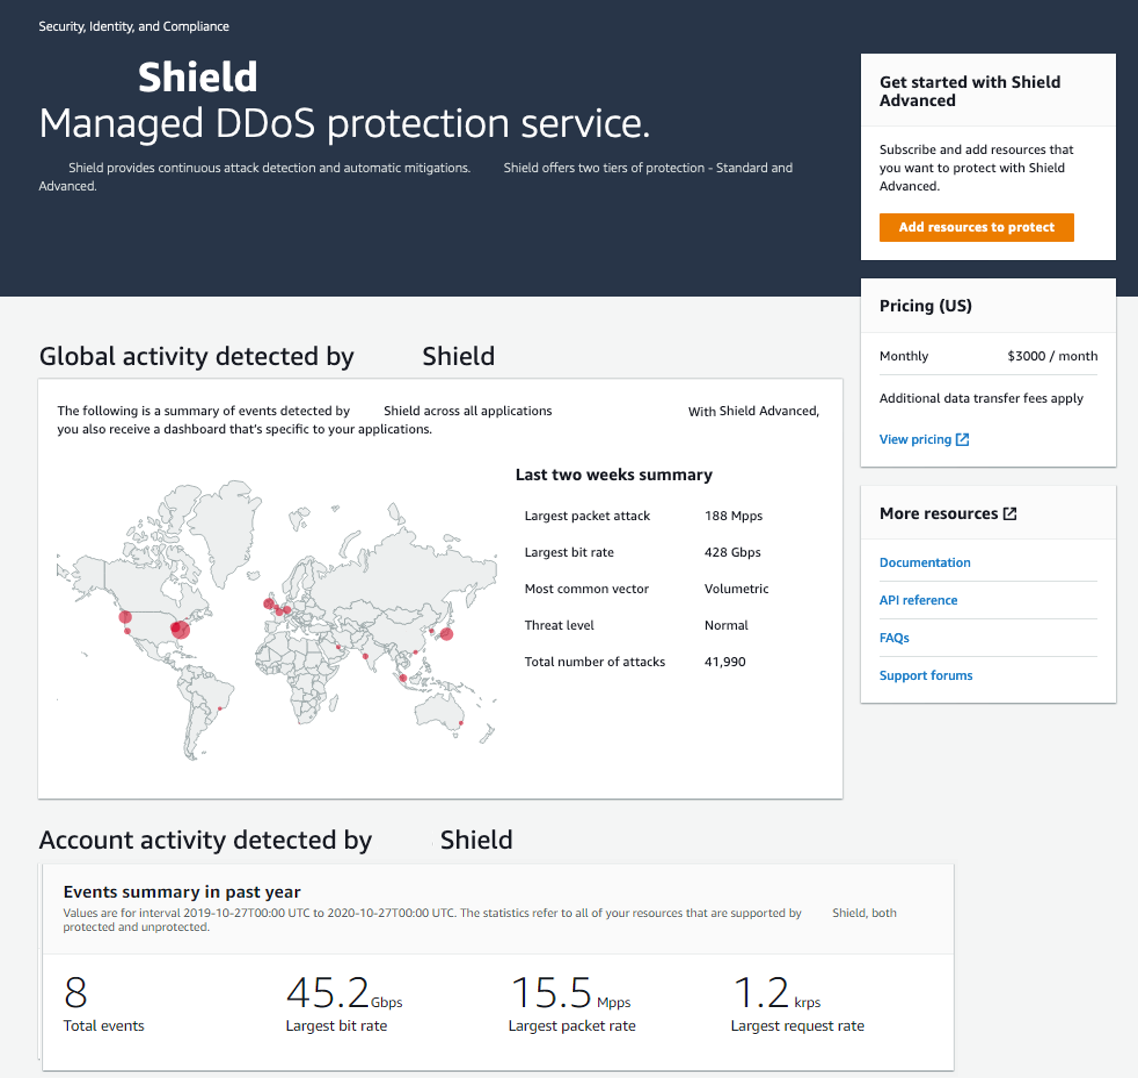
This page provides instructions for accessing an aggregated view of global threat activity and a per-account event summary in the Amazon Shield console Getting Started and Global threat dashboard pages.
The following screenshot shows an example Getting Started page.
To access the Amazon Shield console
Sign in to the Amazon Web Services Management Console and open the Amazon WAF & Shield console at https://console.amazonaws.cn/wafv2/
.
You don't need a subscription to Shield Advanced to access global activity and account event summary information.
Global activity
This information is available through the Amazon Shield console Global threat dashboard and Getting Started pages. The following screenshot shows an example of the global activity pane.
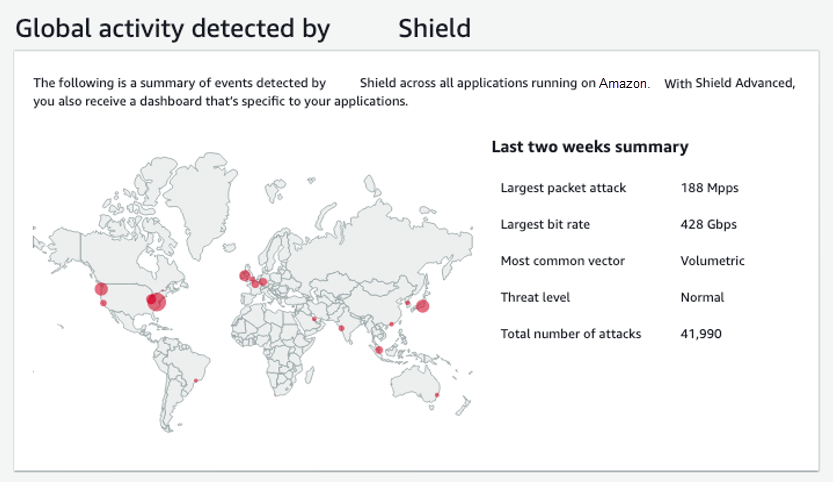
Global activity describes DDoS events observed across all Amazon customers. Once per hour, Amazon updates the information for the prior two weeks. In the console pane, you can see the results, partitioned by Amazon Region and displayed on a world heat map. Next to the map, Shield displays summary information such as the largest packet attack, largest bit rate, most common vector, total number of attacks, and threat level. The threat level is an assessment of the current global activity compared to what Amazon typically observes. The default threat level value is Normal. Amazon automatically updates the value to High for elevated DDoS activity.
The Global threat dashboard also provides time-series metrics and gives you the ability to change between time durations. To view the history of significant DDoS attacks, you can customize the dashboard for views from the last day to the last two weeks. Time-series metrics provide a view of the largest bit rate, packet rate, or request rate for all events detected by Amazon Shield for applications running on Amazon during the time window that you select.
Account activity
This information is available in the Amazon Shield console Getting Started page.
The following screenshot shows an example account activity pane.
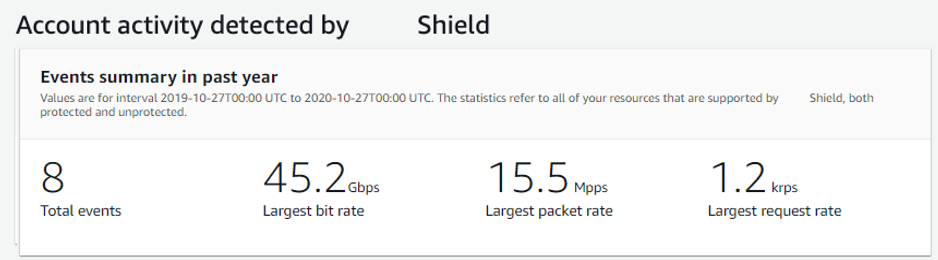
Account activity describes DDoS events that Shield detected for your resources that are eligible for protection by Shield Advanced. Each day, Shield creates summary metrics for the year ending at 00:00 UTC the prior day, and then displays total events, largest bit rate, largest packet rate, and largest request rate.
-
The total events metric reflects every time that Shield observed suspicious attributes in traffic that was destined to your application. Suspicious attributes can include traffic that is at a higher than normal volume, traffic that does not match your application’s historical profile, or traffic that does not match heuristics that are defined by Shield for valid application traffic.
-
Largest bit rate and largest packet rate statistics are available for every resource.
-
The largest request rate statistic is available only for Amazon CloudFront distributions and Application Load Balancers that have an associated Amazon WAF web ACL.
Note
You can also access the account level event summary through the Amazon Shield API operation DescribeAttackStatistics.