本文属于机器翻译版本。若本译文内容与英语原文存在差异,则一律以英文原文为准。
使用服务器遥测指标进行监控
Amazon GameLift Servers可以配置为收集和发布在托管 Amazon EC2 和容器队列上运行的游戏服务器的遥测指标。在将遥测收集器与服务器生成包一起部署后,即可使用这些指标。该指标系统支持所有插件 SDKs (C++、C#、Go)、所有插件(虚幻、Unity)和Amazon GameLift Servers游戏服务器包装器。指标数据流向 Amazon Managed Service for Prometheus、监控 亚马逊 GameLift 服务器 与亚马逊合作 CloudWatch 和 Amazon Managed Grafana 控制面板(推荐用于可视化)。
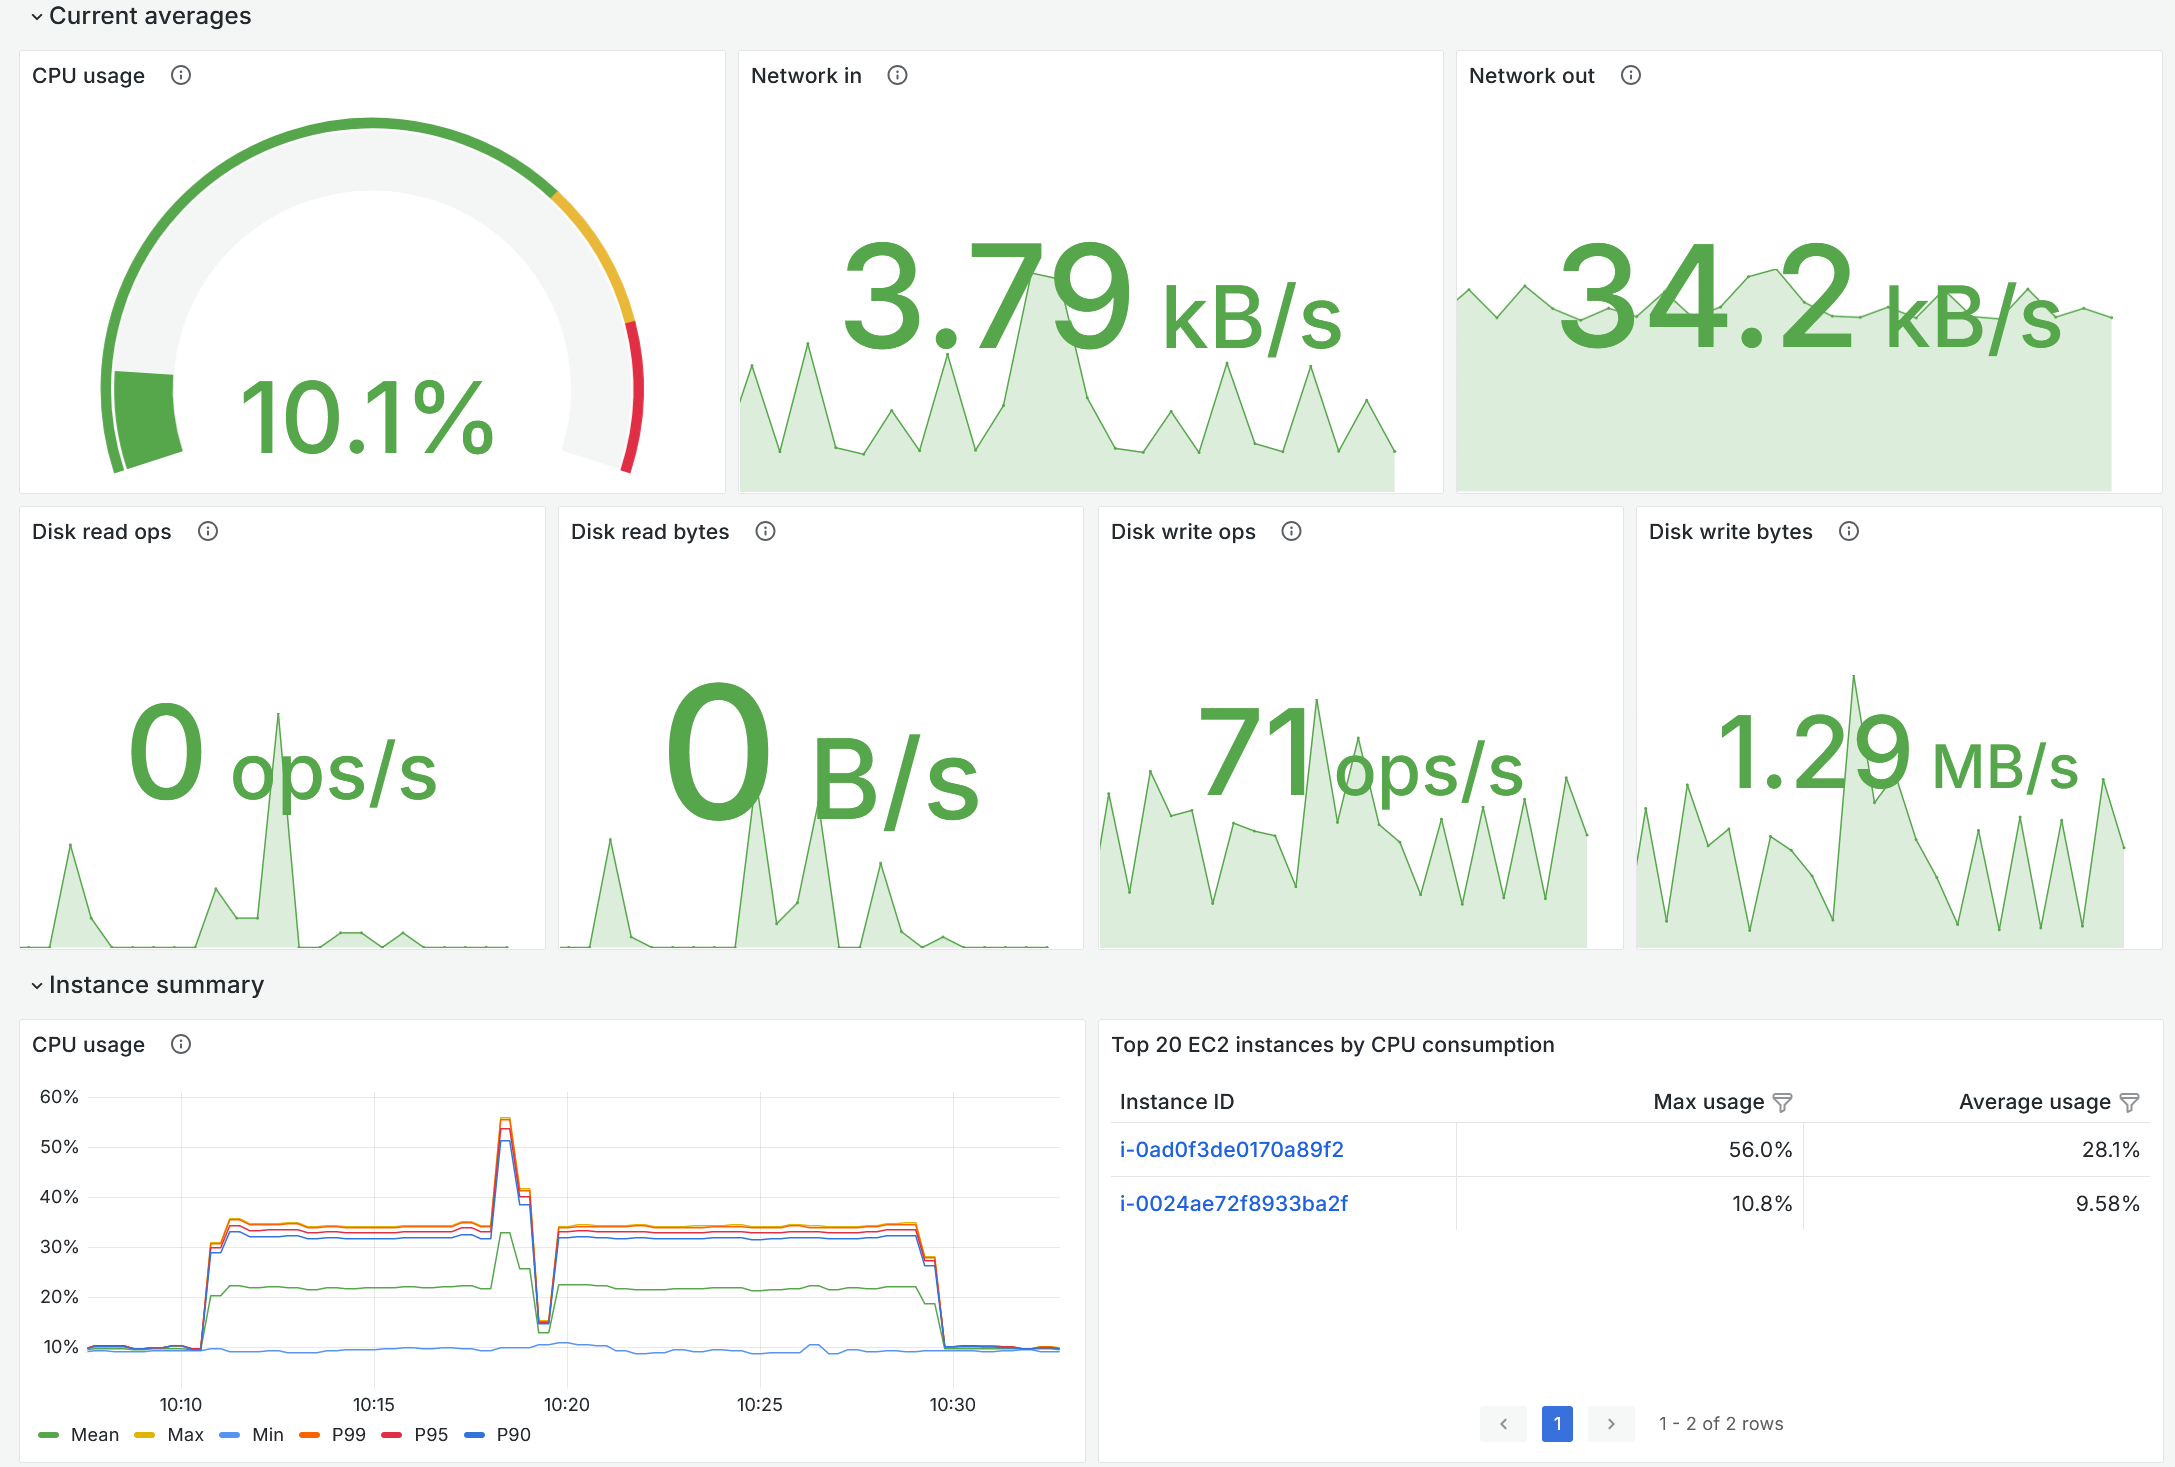
使用 Amazon Managed Grafana 或亚马逊中预建的控制面板监控游戏服务器的性能。 CloudWatch
遥测指标的优势
遥测指标系统具有五个主要优势:
-
特定于游戏引擎的指标:游戏引擎插件(Unreal、Unity)提供与特定于引擎的性能指标的原生集成,例如服务器节拍时间、帧速率和引擎级别的资源利用率,这些指标对于游戏性能优化至关重要。
-
自定义指标支持:使用服务器 SDK 函数调用定义和跟踪您自己的游戏特定指标,以监控与您的游戏相关的自定义游戏事件、业务逻辑性能和特定于应用程序的数据点。
-
自动收集 — 在部署遥测收集器后,指标会自动流动,无需其他工具,并且可以直接与 Prometheus 和 Amazon 的亚马逊托管服务集成。 CloudWatch
-
多级别监控:实例集级指标可监控容量和扩缩事宜,实例级指标可反映资源利用率,游戏会话指标则可跟踪性能。
-
通用兼容性-适用于所有Amazon GameLift Servers支持的开发环境,与所有服务器集成 SDKs,游戏引擎插件中提供原生支持。
注意
遥测指标适用于运行亚马逊 Linux 2023 EC2 或 Windows 的Amazon GameLift Servers托管亚马逊或集装箱舰队。
开始前的准备工作
所需 Amazon 资源
-
Amazon 为配置的帐户Amazon GameLift Servers。
-
在以下位置运行的托管式实例集:
-
支持操作系统的亚马逊 EC2 ,或者
-
安装了 Amazon Linux 2023 的容器
-
-
适当的 IAM 权限
IAM 要求
仅当您计划使用相应服务时,才需要具备以下 IAM 权限:
-
Amazon Managed Service for Prometheus(仅在向 Prometheus 发布指标时需要使用该服务)
-
aps:RemoteWrite许可 -
您的 Prometheus 工作区的访问权限
-
-
亚马逊 CloudWatch(仅在向亚马逊发布指标时才需要 CloudWatch)
-
cloudwatch:PutMetricData许可 -
指标命名空间的访问权限
-
-
Amazon Managed Grafana(仅在使用 Grafana 控制面板时需要使用该服务)
-
grafana:Read许可 -
用于访问控制面板的 SSO 配置
-