percentileCont
The percentileCont
function calculates percentile based on a continuous
distribution of the numbers in the measure. It uses the grouping and sorting that are
applied in the field wells. It answers questions like: What values are representative of
this percentile? To return an exact percentile value that might not be present in your
dataset, use percentileCont
. To return the nearest percentile value that is
present in your dataset, use percentileDisc
instead.
Syntax
percentileCont(
expression
,percentile
, [group-by level])
Arguments
- measure
-
Specifies a numeric value to use to compute the percentile. The argument must be a measure or metric. Nulls are ignored in the calculation.
- percentile
-
The percentile value can be any numeric constant 0–100. A percentile value of 50 computes the median value of the measure.
- group-by level
-
(Optional) Specifies the level to group the aggregation by. The level added can be any dimension or dimensions independent of the dimensions added to the visual.
The argument must be a dimension field. The group-by level must be enclosed in square brackets
[ ]
. For more information, see Level-aware calculation - aggregate (LAC-A) functions.
Returns
The result of the function is a number.
Usage notes
The percentileCont
function calculates a result based on a continuous
distribution of the values from a specified measure. The result is computed by
linear interpolation between the values after ordering them based on settings in the
visual. It's different from percentileDisc
, which simply returns a
value from the set of values that are aggregated over. The result from
percentileCont
might or might not exist in the values from the
specified measure.
Examples of percentileCont
The following examples help explain how percentileCont works.
Example Comparing median, percentileCont
, and
percentileDisc
The following example shows the median for a dimension (category) by using the
median
, percentileCont
, and
percentileDisc
functions. The median value is the same as the
percentileCont value. percentileCont
interpolates a value, which
might or might not be in the data set. However, because
percentileDisc
always displays a value that exists in the
dataset, the two results might not match. The last column in this example shows
the difference between the two values. The code for each calculated field is as
follows:
-
50%Cont = percentileCont(
example
, 50 ) -
median = median(
example
) -
50%Disc = percentileDisc(
example
, 50 ) -
Cont-Disc = percentileCont(
example
, 50 ) − percentileDisc(example
, 50 ) -
example = left(
(To make a simpler example, we used this expression to shorten the names of categories down to their first letter.)category
, 1 )
example median 50%Cont 50%Disc Cont-Disc -------- ----------- ------------ -------------- ------------ A 22.48 22.48 22.24 0.24 B 20.96 20.96 20.95 0.01 C 24.92 24.92 24.92 0 D 24.935 24.935 24.92 0.015 E 14.48 14.48 13.99 0.49
Example 100th percentile as maximum
The following example shows a variety of percentileCont
values
for the example
field. The calculated fields n%Cont
are defined as
percentileCont( {
. The interpolated values in each
column represent the numbers that fall into that percentile bucket. In some
cases, the actual data values match the interpolated values. For example, the
column example
} ,n)100%Cont
shows the same value for every row because 6783.02
is the highest number.
example 50%Cont 75%Cont 99%Cont 100%Cont --------- ----------- ----------- ------------ ----------- A 20.97 84.307 699.99 6783.02 B 20.99 88.84 880.98 6783.02 C 20.99 90.48 842.925 6783.02 D 21.38 85.99 808.49 6783.02
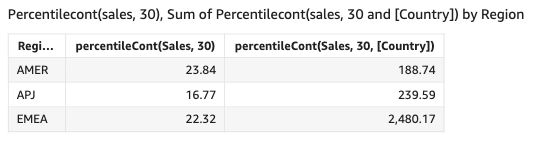
You can also specify at what level to group the computation using one or more dimensions in the view or in your dataset. This is called a LAC-A function. For more information about LAC-A functions, see Level-aware calculation - aggregate (LAC-A) functions. The following example calculates the 30th percentile based on a continuous distribution of the numbers at the Country level, but not across other dimensions (Region) in the visual.
percentileCont({Sales}, 30, [Country])
