percentileRank
The percentileRank function calculates the percentile rank of a measure
or a dimension in comparison to the specified partitions. The percentile rank
value(x) indicates that the current item is above
x% of values in the specified partition. The percentile
rank value ranges from 0 (inclusive) to 100 (exclusive).
Syntax
The brackets are required. To see which arguments are optional, see the following descriptions.
percentileRank ([ sort_order_field ASC_or_DESC, ... ],[ {partition_field}, ... ])
Arguments
- sort order field
-
One or more aggregated measures and dimensions that you want to sort the data by, separated by commas. You can specify either ascending (
ASC) or descending (DESC) sort order.Each field in the list is enclosed in {} (curly braces), if it is more than one word. The entire list is enclosed in [ ] (square brackets).
- partition field
-
(Optional) One or more dimensions that you want to partition by, separated by commas.
Each field in the list is enclosed in {} (curly braces), if it is more than one word. The entire list is enclosed in [ ] (square brackets).
- calculation level
-
(Optional) Specifies the calculation level to use:
-
PRE_FILTER– Prefilter calculations are computed before the dataset filters. -
PRE_AGG– Preaggregate calculations are computed before applying aggregations and top and bottom N filters to the visuals. -
POST_AGG_FILTER– (Default) Table calculations are computed when the visuals display.
This value defaults to
POST_AGG_FILTERwhen blank. For more information, see Using level-aware calculations in Quick Suite. -
Example
The following example does a percentile ranking of max(Sales) in
descending order, by State.
percentileRank ( [max(Sales) DESC], [State] )
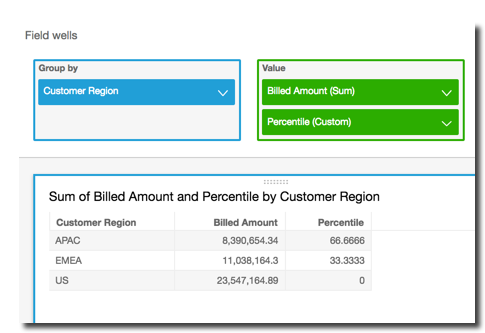
The following example does a percentile ranking of Customer Region by
total Billed Amount. The fields in the table calculation are in the
field wells of the visual.
percentileRank( [sum({Billed Amount}) DESC], [{Customer Region}] )
The following screenshot shows the results of the example, along with the total
Billed Amount so you can see how each region compares.