Amazon Web Services 文档中描述的 Amazon Web Services 服务或功能可能因区域而异。要查看适用于中国区域的差异,请参阅
中国的 Amazon Web Services 服务入门
(PDF)。
本文属于机器翻译版本。若本译文内容与英语原文存在差异,则一律以英文原文为准。
迁移到 OpenTelemetry .NET
在 .NET 应用程序中使用 X-Ray 跟踪功能时,需要采用 X-Ray .NET SDK 并进行手动配置才能进行检测。
本节在使用 SDK 的手动检测解决方案部分中提供了从 X-Ray 手动检测解决方案迁移到.NET 的 OpenTelemetry 手动检测解决方案的代码示例。或者,您可以从 X-Ray 手动检测迁移到 OpenTelemetry 自动检测解决方案,以检验.NET 应用程序,而不必零代码自动检测解决方案在本节中修改应用程序源代码。
零代码自动检测解决方案
OpenTelemetry 提供零代码自动检测解决方案。这些解决方案无需更改应用程序代码即可跟踪请求。
OpenTelemetry基于自动仪表选项
使用 SDK 的手动检测解决方案
- Tracing configuration with X-Ray SDK
-
对于 .NET Web 应用程序,X-Ray SDK 是在 Web.config 文件的 appSettings 部分配置的。
Web.config 示例
<configuration>
  <appSettings>
    <add key="AWSXRayPlugins" value="EC2Plugin"/>
  </appSettings>
</configuration>
对于 .NET Core,使用名为 appsettings.json 的文件,其顶层键名为 XRay,然后构建一个配置对象来初始化 X-Ray 记录器。
.NET appsettings.json 的示例
{
  "XRay": {
    "AWSXRayPlugins": "EC2Plugin"
  }
}
.NET Core Program.cs 的示例 – 记录器配置
using Amazon.XRay.Recorder.Core;
...
AWSXRayRecorder.InitializeInstance(configuration);
- Tracing configuration with OpenTelemetry SDK
-
添加以下依赖项:
dotnet add package OpenTelemetry
dotnet add package OpenTelemetry.Contrib.Extensions.AWSXRay
dotnet add package OpenTelemetry.Sampler.AWS --prerelease
dotnet add package OpenTelemetry.Resources.AWS
dotnet add package OpenTelemetry.Exporter.OpenTelemetryProtocol
dotnet add package OpenTelemetry.Extensions.Hosting
dotnet add package OpenTelemetry.Instrumentation.AspNetCore
对于您的.NET 应用程序,请通过设置 Global 来配置 OpenTelemetry SDK TracerProvider。以下示例配置还为 ASP.NET Core 启用了检测。要检测 ASP.NET,请参阅跟踪传入请求(ASP.NET 和 ASP.NET Core 检测)。要与其他框架 OpenTelemetry 一起使用,请参阅注册表,了解更多支持的框架的库。
建议您配置以下组件:
-
An OTLP Exporter— 将跟踪导出到 CloudWatch Agent/Collecto OpenTelemetry r 时需要此选项
-
Amazon X-Ray 传播器 — 将跟踪上下文传播到与 X-Ray 集成的Amazon 服务所必需的
-
Amazon X-Ray-Remote 采样器 — 如果您需要使用 X-Ray 采样规则对请求进行采样,则为必填项
-
Resource Detectors(例如 Amazon EC2 资源检测器)– 检测运行应用程序的主机的元数据
using OpenTelemetry;
using OpenTelemetry.Contrib.Extensions.AWSXRay.Trace;
using OpenTelemetry.Sampler.AWS;
using OpenTelemetry.Trace;
using OpenTelemetry.Resources;

var builder = WebApplication.CreateBuilder(args);

var serviceName = "MyServiceName";
var serviceVersion = "1.0.0";

var resourceBuilder = ResourceBuilder
    .CreateDefault()
    .AddService(serviceName: serviceName)
    .AddAWSEC2Detector();

builder.Services.AddOpenTelemetry()
    .ConfigureResource(resource => resource
        .AddAWSEC2Detector()
        .AddService(
            serviceName: serviceName,
            serviceVersion: serviceVersion))
    .WithTracing(tracing => tracing
        .AddSource(serviceName)
        .AddAspNetCoreInstrumentation()
        .AddOtlpExporter()
        .SetSampler(AWSXRayRemoteSampler.Builder(resourceBuilder.Build())
            .SetEndpoint("http://localhost:2000")
            .Build()));

Sdk.SetDefaultTextMapPropagator(new AWSXRayPropagator()); // configure  X-Ray propagator
要 OpenTelemetry 用于控制台应用程序,请在程序启动时添加以下 OpenTelemetry 配置。
using OpenTelemetry;
using OpenTelemetry.Contrib.Extensions.AWSXRay.Trace;
using OpenTelemetry.Trace;
using OpenTelemetry.Resources;

var serviceName = "MyServiceName";

var resourceBuilder = ResourceBuilder
    .CreateDefault()
    .AddService(serviceName: serviceName)
    .AddAWSEC2Detector();

var tracerProvider = Sdk.CreateTracerProviderBuilder()
    .AddSource(serviceName)
    .ConfigureResource(resource =>
        resource
            .AddAWSEC2Detector()
            .AddService(
                serviceName: serviceName,
                serviceVersion: serviceVersion
            )
        )
    .AddOtlpExporter() // default address localhost:4317
    .SetSampler(new TraceIdRatioBasedSampler(1.00))
    .Build();

Sdk.SetDefaultTextMapPropagator(new AWSXRayPropagator()); // configure  X-Ray propagator
手动创建跟踪数据
- With X-Ray SDK
-
如果使用 X-Ray SDK,则需要通过 BeginSegment 和 BeginSubsegment 方法来手动创建 X-Ray 分段和子分段。
using Amazon.XRay.Recorder.Core;

AWSXRayRecorder.Instance.BeginSegment("segment name"); // generates `TraceId` for you
try
{
    // Do something here
    // can create custom subsegments
    AWSXRayRecorder.Instance.BeginSubsegment("subsegment name");
    try
    {
        DoSometing();
    }
    catch (Exception e)
    {
        AWSXRayRecorder.Instance.AddException(e);
    }
    finally
    {
        AWSXRayRecorder.Instance.EndSubsegment();
    }
}
catch (Exception e)
{
    AWSXRayRecorder.Instance.AddException(e);
}
finally
{
    AWSXRayRecorder.Instance.EndSegment();
}
- With OpenTelemetry SDK
-
在 .NET 中,您可以使用活动 API 创建自定义跨度,以监控未被检测库捕获的内部活动的性能。请注意,只有服务器类跨度会转换为 X-Ray 分段,所有其他跨度均转换为 X-Ray 子分段。
您可以根据需要创建任意数量的 ActivitySource 实例,但建议针对整个应用程序/服务仅创建一个实例。
using System.Diagnostics;

ActivitySource activitySource = new ActivitySource("ActivitySourceName", "ActivitySourceVersion");


...


using (var activity = activitySource.StartActivity("ActivityName", ActivityKind.Server)) // this will be translated to a X-Ray Segment
{
    // Do something here

    using (var internalActivity = activitySource.StartActivity("ActivityName", ActivityKind.Internal)) // this will be translated to an X-Ray Subsegment
    {
        // Do something here
    }
}
使用 OpenTelemetry SDK 向跟踪添加注释和元数据
您还可以通过在活动上使用 SetTag 方法,将自定义键值对作为属性添加到跨度中。请注意,默认情况下,所有跨度属性都将转换为 X-Ray 原始数据中的元数据。为确保将属性转换为注释而不是元数据,您可以将该属性的键添加到 aws.xray.annotations 属性列表中。
using (var activity = activitySource.StartActivity("ActivityName", ActivityKind.Server)) // this will be translated to a X-Ray Segment
{
    activity.SetTag("metadataKey", "metadataValue");
    activity.SetTag("annotationKey", "annotationValue");
    string[] annotationKeys = {"annotationKey"};
    activity.SetTag("aws.xray.annotations", annotationKeys);

    // Do something here

    using (var internalActivity = activitySource.StartActivity("ActivityName", ActivityKind.Internal)) // this will be translated to an X-Ray Subsegment
    {
        // Do something here
    }
}
使用 OpenTelemetry 自动仪器
如果您使用的是适用于.NET 的 OpenTelemetry 自动插桩解决方案,并且需要在应用程序中执行手动插入,例如,在应用程序本身中检测任何自动插桩库未涵盖的部分的代码。
由于只能有一个全局 TracerProvider,因此如果与自动检测结合使用,则手动检测不应实例化自己的 TracerProvider。使用TracerProvider时,自定义手动跟踪的工作方式与通过 OpenTelemetry SDK 使用自动检测或手动检测的方式相同。
跟踪传入请求(ASP.NET 和 ASP.NET Core 检测)
- With X-Ray SDK
-
要检测 ASP.NET 应用程序提供的请求,请参阅https://docs.amazonaws.cn/xray/latest/devguide/xray-sdk-dotnet-messagehandler.html,了解如何在 global.asax 文件的 Init 方法中调用 RegisterXRay。
AWSXRayASPNET.RegisterXRay(this, "MyApp");
要检测由 ASP.NET Core 应用程序提供的请求,需要在调用启动类 UseXRay 方法中的任何其他中间件之前调用 Configure 方法。
app.UseXRay("MyApp");
- With OpenTelemetry SDK
OpenTelemetry 还提供了用于收集 ASP.NET 和 ASP.NET 内核传入 Web 请求的跟踪的工具库。以下部分列出了为您的 OpenTelemetry 配置添加和启用这些库工具所需的步骤,包括在创建 Tracer Provider 时如何添加 ASP.NET 或 ASP.NET 核心工具。
有关如何启用 OpenTelemetry .Instrumention 的信息。 AspNet,请参阅启用 OpenTelemetry .Instrumention 的步骤。 AspNet以及有关如何启用 OpenTelemetry .Instrumentation 的信息。 AspNetCore,请参阅启用 OpenTelemetry .Instrumention 的步骤。 AspNetCore。
Amazon 软件开发工具包工具
- With X-Ray SDK
-
通过调用安装所有 Amazon SDK 客户端RegisterXRayForAllServices()。
using Amazon.XRay.Recorder.Handlers.AwsSdk;
AWSSDKHandler.RegisterXRayForAllServices(); //place this before any instantiation of AmazonServiceClient
AmazonDynamoDBClient client = new AmazonDynamoDBClient(RegionEndpoint.USWest2); // AmazonDynamoDBClient is automatically registered with X-Ray
使用以下方法之一进行特定的 Amazon 服务客户端检测。
AWSSDKHandler.RegisterXRay<IAmazonDynamoDB>(); // Registers specific type of AmazonServiceClient : All instances of IAmazonDynamoDB created after this line are registered
AWSSDKHandler.RegisterXRayManifest(String path); // To configure custom Amazon Service Manifest file. This is optional, if you have followed "Configuration" section
- With OpenTelemetry SDK
对于以下代码示例,您将需要以下依赖项:
dotnet add package OpenTelemetry.Instrumentation.AWS
要对 S Amazon DK 进行检测,请更新设置全局 TracerProvider 的 OpenTelemetry SDK 配置。
builder.Services.AddOpenTelemetry()
    ...
    .WithTracing(tracing => tracing
        .AddAWSInstrumentation()
        ...
检测传出 HTTP 调用
- With X-Ray SDK
-
X-Ray .NET SDK 在使用 System.Net.HttpWebRequest 时通过扩展方法 GetResponseTraced() 或 GetAsyncResponseTraced() 跟踪传出 HTTP 调用,或者在使用 System.Net.Http.HttpClient 时通过 HttpClientXRayTracingHandler 处理程序跟踪传出 HTTP 调用。
- With OpenTelemetry SDK
-
对于以下代码示例,您将需要以下依赖项:
dotnet add package OpenTelemetry.Instrumentation.Http
要检测System.Net.Http.HttpClient和System.Net.HttpWebRequest,请更新设置全局 TracerProvider 的 OpenTelemetry SDK 配置。
builder.Services.AddOpenTelemetry()
    ...
    .WithTracing(tracing => tracing
        .AddHttpClientInstrumentation()
        ...
对其他库的检测支持
您可以在 OpenTelemetry 注册表中搜索和筛选.NET 工具库,以了解您的库是否 OpenTelemetry 支持插入。请查看注册表开始搜索。
Lambda 检测
- With X-Ray SDK
-
要将 X-Ray SDK 与 Lambda 结合使用,需要完成以下过程:
-
在 Lambda 函数上启用主动跟踪。
-
Lambda 服务会创建一个表示处理程序调用的分段
-
使用 X-Ray SDK 创建子分段或检测库
- With OpenTelemetry-based solutions
-
您可以使用已打开的 Lambda 图层自动检测您的 Lambda Amazon 。有两种解决方案:
OpenTelemetry 针对 Amazon Lambda 的手动检测
以下是 Lambda 函数代码(不带检测)示例。
using System;
using System.Text;
using System.Threading.Tasks;
using Amazon.Lambda.Core;
using Amazon.S3;
using Amazon.S3.Model;

// Assembly attribute to enable Lambda function logging
[assembly: LambdaSerializer(typeof(Amazon.Lambda.Serialization.SystemTextJson.DefaultLambdaJsonSerializer))]

namespace ExampleLambda;

public class ListBucketsHandler
{
    private static readonly AmazonS3Client s3Client = new();

    // new Lambda function handler passed in
    public async Task<string> HandleRequest(object input, ILambdaContext context)
    {
        try
        {
            var DoListBucketsAsyncResponse = await DoListBucketsAsync();
            context.Logger.LogInformation($"Results: {DoListBucketsAsyncResponse.Buckets}");

            context.Logger.LogInformation($"Successfully called ListBucketsAsync");
            return "Success!";
        }
        catch (Exception ex)
        {
            context.Logger.LogError($"Failed to call ListBucketsAsync: {ex.Message}");
            throw;
        }
    }

    private async Task<ListBucketsResponse> DoListBucketsAsync()
    {
        try
        {
            var putRequest = new ListBucketsRequest
            {
            };

            var response = await s3Client.ListBucketsAsync(putRequest);
            return response;
        }
        catch (AmazonS3Exception ex)
        {
            throw new Exception($"Failed to call ListBucketsAsync: {ex.Message}", ex);
        }
    }
}
要手动检测 Lambda 处理程序和 Amazon S3 客户端,请执行以下操作。
-
实例化 a TracerProvider — 建议配置 TracerProvider 为 Always On Sampler,service.name设置为 Lambda 函数名称。XrayUdpSpanExporter ParentBased Resource
-
通过调用将 S OpenTemetry Amazon DK 客户端插桩添加AddAWSInstrumentation()到 Amazon Amazon S3 客户端 TracerProvider
-
创建一个与原始 Lambda 函数具有相同签名的封装器函数。调用 AWSLambdaWrapper.Trace() API 并将 TracerProvider、原始 Lambda 函数及其输入作为参数传递。将封装器函数设置为 Lambda 处理程序输入。
对于以下代码示例,您将需要以下依赖项:
dotnet add package OpenTelemetry.Instrumentation.AWSLambda
dotnet add package OpenTelemetry.Instrumentation.AWS
dotnet add package OpenTelemetry.Resources.AWS
dotnet add package AWS.Distro.OpenTelemetry.Exporter.Xray.Udp
以下代码演示了进行必要更改后的 Lambda 函数。您可以创建其他自定义跨度来补充自动提供的跨度。
using Amazon.Lambda.Core;
using Amazon.S3;
using Amazon.S3.Model;
using OpenTelemetry;
using OpenTelemetry.Instrumentation.AWSLambda;
using OpenTelemetry.Trace;
using AWS.Distro.OpenTelemetry.Exporter.Xray.Udp;
using OpenTelemetry.Resources;

// Assembly attribute to enable Lambda function logging
[assembly: LambdaSerializer(typeof(Amazon.Lambda.Serialization.SystemTextJson.DefaultLambdaJsonSerializer))]

namespace ExampleLambda;

public class ListBucketsHandler
{
    private static readonly AmazonS3Client s3Client = new();

    TracerProvider tracerProvider = Sdk.CreateTracerProviderBuilder()
        .AddAWSLambdaConfigurations()
        .AddProcessor(
            new SimpleActivityExportProcessor(
                // AWS_LAMBDA_FUNCTION_NAME Environment Variable will be defined in AWS Lambda Environment
                new XrayUdpExporter(ResourceBuilder.CreateDefault().AddService(Environment.GetEnvironmentVariable("AWS_LAMBDA_FUNCTION_NAME")).Build())
            )
        )
        .AddAWSInstrumentation()
        .SetSampler(new ParentBasedSampler(new AlwaysOnSampler()))
        .Build();

    // new Lambda function handler passed in
    public async Task<string> HandleRequest(object input, ILambdaContext context)
    => await AWSLambdaWrapper.Trace(tracerProvider, OriginalHandleRequest, input, context);

    public async Task<string> OriginalHandleRequest(object input, ILambdaContext context)
    {
        try
        {
            var DoListBucketsAsyncResponse = await DoListBucketsAsync();
            context.Logger.LogInformation($"Results: {DoListBucketsAsyncResponse.Buckets}");

            context.Logger.LogInformation($"Successfully called ListBucketsAsync");
            return "Success!";
        }
        catch (Exception ex)
        {
            context.Logger.LogError($"Failed to call ListBucketsAsync: {ex.Message}");
            throw;
        }
    }

    private async Task<ListBucketsResponse> DoListBucketsAsync()
    {
        try
        {
            var putRequest = new ListBucketsRequest
            {
            };

            var response = await s3Client.ListBucketsAsync(putRequest);
            return response;
        }
        catch (AmazonS3Exception ex)
        {
            throw new Exception($"Failed to call ListBucketsAsync: {ex.Message}", ex);
        }
    }
}
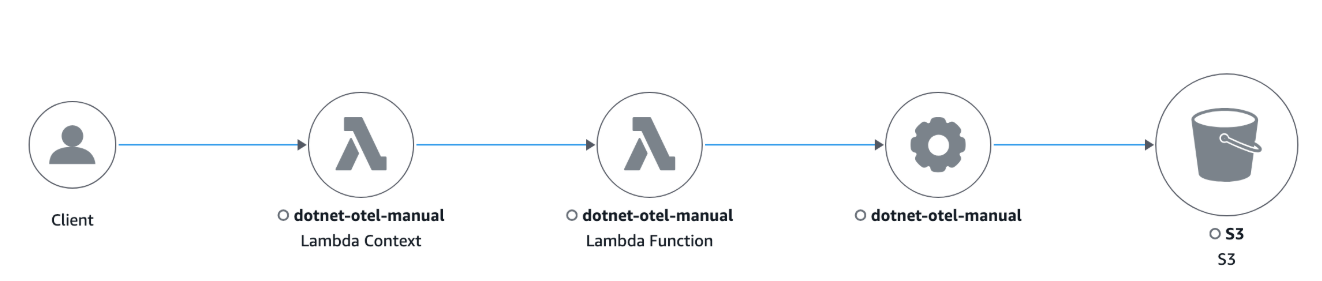
调用此 Lambda 时,您将在控制台的跟踪映射中 CloudWatch 看到以下跟踪: