Get statistics for a specific instance
You can use the Amazon Web Services Management Console or the Amazon CLI to get statistics for a specific instance. The following examples show you how to use the Amazon Web Services Management Console or the Amazon CLI to determine the maximum CPU utilization of a specific EC2 instance.
Requirements
-
You must have the ID of the instance. You can get the instance ID using the Amazon Web Services Management Console or the describe-instances command.
-
By default, basic monitoring is enabled, but you can enable detailed monitoring. For more information, see Manage detailed monitoring for your EC2 instances.
To display the CPU utilization for a specific instance (console)
-
Open the CloudWatch console at https://console.amazonaws.cn/cloudwatch/
. -
In the navigation pane, choose Metrics.
-
Choose the EC2 metric namespace.
-
Choose the Per-Instance Metrics dimension.
-
In the search field, enter
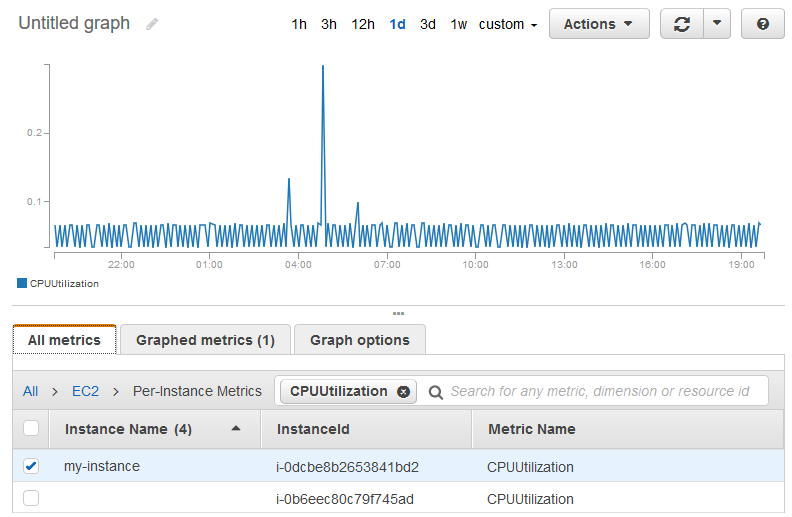
CPUUtilizationand press Enter. Choose the row for the specific instance, which displays a graph for the CPUUtilization metric for the instance. To name the graph, choose the pencil icon. To change the time range, select one of the predefined values or choose custom.
-
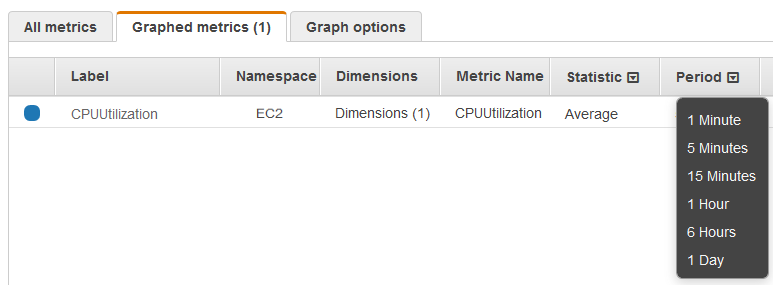
To change the statistic or the period for the metric, choose the Graphed metrics tab. Choose the column heading or an individual value, and then choose a different value.

To get the CPU utilization for a specific instance (Amazon CLI)
Use the following get-metric-statistics command to get the CPUUtilization metric for the specified instance, using the specified period and time interval:
aws cloudwatch get-metric-statistics --namespace AWS/EC2 --metric-name CPUUtilization --period 3600 \ --statistics Maximum --dimensions Name=InstanceId,Value=i-1234567890abcdef0\ --start-time2022-10-18T23:18:00--end-time2022-10-19T23:18:00
The following is example output. Each value represents the maximum CPU utilization percentage for a single EC2 instance.
{
    "Datapoints": [
        {
            "Timestamp": "2022-10-19T00:18:00Z",
            "Maximum": 0.33000000000000002,
            "Unit": "Percent"
        },
        {
            "Timestamp": "2022-10-19T03:18:00Z",
            "Maximum": 99.670000000000002,
            "Unit": "Percent"
        },
        {
            "Timestamp": "2022-10-19T07:18:00Z",
            "Maximum": 0.34000000000000002,
            "Unit": "Percent"
        },
        {
            "Timestamp": "2022-10-19T12:18:00Z",
            "Maximum": 0.34000000000000002,
            "Unit": "Percent"
        }
    ],
    "Label": "CPUUtilization"
}