Troubleshoot with CloudWatch Logs Live Tail
CloudWatch Logs Live Tail helps you quickly troubleshoot incidents by viewing a streaming list of new log events as they are ingested. You can view, filter, and highlight ingested logs in near real time, helping you to detect and resolve issues quickly. You can filter the logs based on terms you specify, and also highlight logs that contain specified terms to help you quickly find what you are looking for.
Live Tail sessions incur costs by session usage time, per minute.
For more information about
pricing, see the Logs
tab at Amazon CloudWatch Pricing
Live Tail is supported only for log groups in the Standard log class. For more information about log classes, see Log classes.
The following sections explain how to use Live Tail in the console and in the Amazon CLI. You can also start a Live Tail session programatically. For more information, see StartLiveTail. For SDK examples, see Start a Live Tail session using an Amazon SDK.
You can also use Live Tail in the Amazon Toolkit for Visual Studio Code. To start a Live Tail session from the VS Code Command Palette, see the Amazon CloudWatch Logs Live Tail section of the Amazon Toolkit for Visual Studio Code User Guide.
The Live Tail feature is available in all commercial Amazon Regions. It is not available in the China Regions or the Amazon GovCloud (US) Regions.
Note
The StartLiveTail API routes requests using SDK host prefix injection. SDK versions released before April 1, 2026 route to
streaming-logs., which does not support VPC endpoints. SDK versions released on or after April 1, 2026 route to
Region.amazonaws.comstream-logs., which supports VPC endpoints. To set up a VPC endpoint for this API, see Creating a VPC endpoint for CloudWatch Logs
.Region.amazonaws.com
Start a Live Tail session using the Amazon CLI
The start-live-tail Amazon CLI command starts a Live Tail streaming session for one or more log groups in a terminal.
A Live Tail session can last for up to three hours. If more than 500 log events per second match the filter, the log events that are displayed
are a sample of the total log events, to provide a real-time tailing experience. For more information about the start-live-tail command,
see start-live-tail
You can use the start-live-tail in two modes:
print-only– this is the default mode
interactive
print-only
In print-only mode, log events are streamed on the terminal. New events are added at the bottom every second,
creating a near real-time tailing experience similar to tail -f on Linux.
To start a Live Tail session in print-only mode, enter the following command.
aws logs start-live-tail --log-group-identifiers arn:aws:logs:us-east-1:111111222222:log-group:my-logs
When you use print-only mode, you can also pipe it with other Linux commands to increase its analytical capabilities. The following example
filters log events with the error keyword and prints the second and fourth column of these events to help you extract particular information.
aws logs start-live-tail --log-group-identifiers arn:aws:logs:us-east-1:111111222222:log-group:my-logs--mode print-only | grep "error" | awk '{print $2, $4}'
interactive
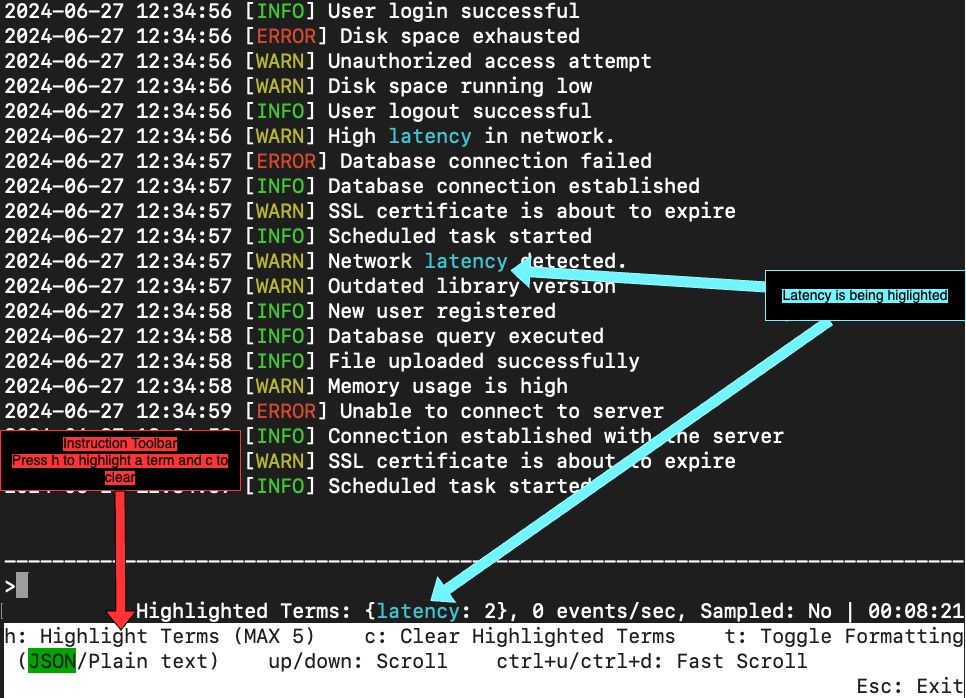
In interactive mode, you can highlight terms and toggle the format of the output log events between JSON and plain text.
Interactive mode also displays information about the Live Tail session such as session duration, whether the session is being sampled,
and the current highlighted terms and the count of the times they have been encountered.
To start a Live Tail session in interactive mode, enter the following command.
aws logs start-live-tail --log-group-identifiers arn:aws:logs:us-east-1:111111222222:log-group:my-logs--mode interactive
The Live Tail session begins. The following video shows part of an example session.
To highlight a term in the streaming logs, press h and then enter the term. The following shows the screen after the term latency
has been highlighted.
To clear a highlighted term, press c and then type the number that represents the term that you want to stop highlighting.
You can press t to toggle the display format of incoming events between JSON and plain text. This toggle functionality is best-effort and happens only if the log event format is compatible.
You can use the up arrow and down arrow keys to scroll, and use CTRL+u and CTRL+d to scroll faster.
The following image displays the highlighting of the latency term during a Live Tail session.
Start a Live Tail session in the console
You use the CloudWatch console to start a Live Tail session. The following procedure explains how to start a Live Tail session by using the Live tail option in the left navigation pane. You can also start Live Tail sessions from the Log Groups page or the CloudWatch Logs Insights page.
If you are using data protection policies to mask sensitive data in a log group that you are viewing with Live Tail, the sensitive data always appears masked in the Live Tail session. For more information about masking sensitive data in log groups, see Help protect sensitive log data with masking.
Important
If your network security team doesn't allow the use of web sockets, you can't currently access the Live Tail portion of the CloudWatch console. You can use Live Tail with the Amazon CLI or APIs. For more information, see Start a Live Tail session using the Amazon CLI and StartLiveTail.
To start a Live Tail session
-
Open the CloudWatch console at https://console.amazonaws.cn/cloudwatch/
. -
In the navigation pane, choose Logs, Live tail.
-
For Select log groups, select the log groups that you want to view events from, in the Live Tail session. You can select as many as 10 log groups.
-
(Optional) If you selected only one log group, you can filter your Live Tail session further by selecting one or more log streams to view log events from. To do so, under Select log streams, select the names of the log streams from the drop down list. Alternatively, you can use the second box under Select log streams to enter a log stream name prefix, and then all log streams with names that match the prefix will be selected.
-
(Optional) To display only log events that contain certain words or other strings, enter the word or string in
Add filter patterns.For example, to display only log events that include the word
Warning, enterWarning. The filters field is case-sensitive. You can include multiple terms and pattern operators in this field:error 404displays only log events that include botherrorand404?Error ?errordisplays log events that include eitherErrororerror-INFOdisplays all log events that don't includeINFO{ $.eventType = "UpdateTrail" }displays all JSON log events where the value of the event type field isUpdateTrail
You can also use regular expression (regex) to filter:
%ERROR%uses regex to display all log events consisting of the ERROR keyword{ $.names = %Steve% }uses regex to display JSON log events where Steve is in the property"name"[ w1 = %abc%, w2 ]uses regex to display space-delimited log events where the first word is abc
For more information about pattern syntax, see Filter pattern syntax.
(0ptional) To highlight some of the displayed log events, enter a term to search for and highlight under Live Tail. Enter highlight terms one at a time. If you add multiple terms to highlight, a different color is assigned to represent each term. A highlight indicator is displayed to the left of any log event that contains the specified term, and also appears under the term itself when you expand the log event in the main window to view the full log event.
You can use filtering along with highlighting to quickly troubleshoot issues. For example, you might filter the events to display only the events that contain
Error, and then also highlight the events that contain404.To start the session, choose Apply filters
Matching log events begin appearing in the window. The following information is also displayed:
The timer displays how long the Live Tail session has been active.
events/sec displays how many ingested log events per second match the filters that you have set.
To keep the session from scrolling too fast because many events match the filters, CloudWatch Logs might display only some matching events. If this happens, the percentage of matching events that are displayed on screen is shown in % displayed.
To pause the flow of events to investigate what is currently displayed, choose anywhere in the events window.
During the session, you can use the following to see more details about each log event.
To display the entire text for a log event in the main window, choose the arrow next to that log event.
To display the entire text for a log event in a side window, choose the + magnifying glass next to that log event. The event flow pauses and the side window appears.
Displaying a log event text in the side window can be useful to compare its text to other events in the main window.
To stop the Live Tail session, choose Stop.
To restart the session, optionally use the Filter panel to modify the filtering criteria, and choose Apply filters. Then choose Start.