Analyzing, optimizing, and reducing CloudWatch costs
This section describes how Amazon CloudWatch features generate costs. It also provides methods that
can help you analyze, optimize, and reduce CloudWatch costs. Throughout this section, we sometimes
refer to pricing when describing CloudWatch features. For information about pricing, see Amazon CloudWatch
pricing
Topics
Analyze CloudWatch cost and usage data with Cost Explorer
With Amazon Cost Explorer, you can visualize and analyze cost and usage data for Amazon Web Services services
over time, including CloudWatch. For more information, see Getting started with Amazon Cost Explorer
The following procedure describes how to use Cost Explorer to visualize and analyze CloudWatch cost and usage data.
To visualize and analyze CloudWatch cost and usage data
-
Sign in to the Cost Explorer console at https://console.aws.amazon.com/cost-management/home#/custom
. -
Under FILTERS, for Service, select CloudWatch.
-
For Group by, choose Usage Type. You can also group your results by other categories, such as the following:
-
API Operation – See which API operations generated the most costs.
-
Region – See which Regions generated the most costs.
-
The following image shows an example of the costs that CloudWatch features generated over six months.
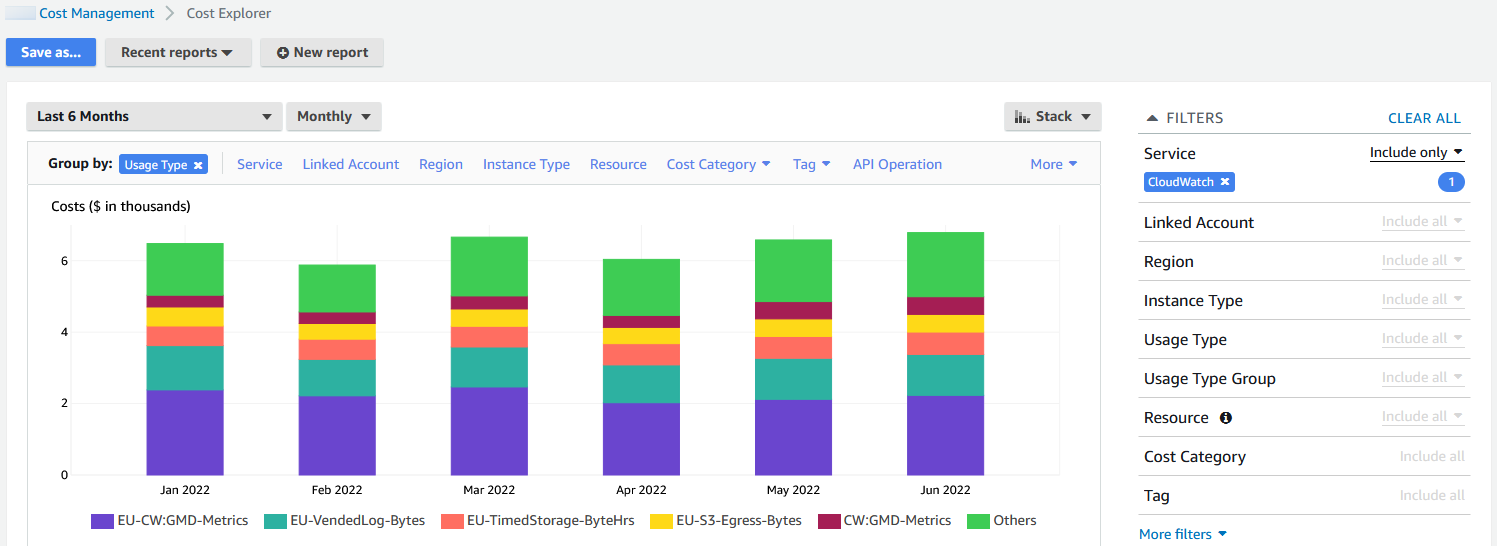
To see which CloudWatch features generated the most costs, look at the values for
UsageType. For example, EU-CW:GMD-Metrics represents
the costs that CloudWatch bulk API requests generated.
Note
The strings for UsageType match specific features and Regions.
For example, the first part of EU-CW:GMD-Metrics (EU)
matches the Europe (Ireland) Region, and the second part of
EU-CW:GMD-Metrics (GMD-Metrics) matches CloudWatch bulk
API requests.
The entire string for UsageType can be formatted as follows:
<Region>-CW:<Feature> or
<Region>-<Feature>.
Some CloudWatch features such as logs and alarms also uses the Global
Region to identify the Free Tier usage. For example,
Global-DataScanned-Bytes represents free CloudWatch Logs data ingestion
usage.
To enhance readability, the strings for UsageType in the tables
throughout this document have been shortened to their string suffixes. For
example, EU-CW:GMD-Metrics is shortened to
GMD-Metrics.
The following table includes the names of each CloudWatch feature, lists the names of
each sub-feature, and lists the strings for UsageType.
| CloudWatch feature | CloudWatch sub-feature |
|
|---|---|---|
| CloudWatch metrics | Custom metrics |
|
| Detailed monitoring |
|
|
| Embedded metrics |
|
|
| OpenTelemetry metrics (observations) |
|
|
| OpenTelemetry metrics (ingestion) |
|
|
|
|
||
|
|
||
| PromQL queries |
|
|
| PromQL alarms |
|
|
| Metrics centralization |
|
|
| Metrics centralization (free tier) |
|
|
| CloudWatch API requests | API requests |
|
| Bulk (Get) |
|
|
| Contributor Insights |
|
|
| Bitmap image snapshot |
|
|
| CloudWatch metric streams | Metric streams |
|
| CloudWatch dashboards | Dashboard with 50 or fewer metrics |
|
| Dashboard with more than 50 metrics |
|
|
| CloudWatch alarms | Standard (metric alarm) |
|
| High resolution (metric alarm) |
|
|
| Metrics Insights query alarm |
|
|
| Composite (aggregated alarm) |
|
|
| Container Insights | Enhanced observability for Amazon EKS |
|
| Enhanced observability for Amazon ECS |
|
|
| CloudWatch Application Signals | Application Signals with Transaction Search |
|
| Application Signals with X-Ray |
|
|
| CloudWatch custom logs | Collect (data ingestion for Standard log class) |
|
| Collect (data ingestion for Infrequent Access log class) |
|
|
| Analyze (query) |
|
|
| Analyze (Live Tail) |
|
|
| Store (archive) |
|
|
| Detect and mask (data protection) |
|
|
| CloudWatch vended logs | Delivery (Amazon CloudWatch Logs Standard log class) |
|
| Delivery (CloudWatch Logs Infrequent Access log class) |
|
|
| Delivery (Amazon S3) |
|
|
| Delivery (Amazon S3) in Parquet format |
|
|
| Delivery (Amazon Data Firehose) |
|
|
| Contributor Insights | CloudWatch Logs (Rules) |
|
| CloudWatch Logs (Events) |
|
|
| Amazon DynamoDB (Rules) |
|
|
| DynamoDB Events) |
|
|
| Database Insights | Serverless | DatabaseInsights-ACU-Hours |
| Provisioned | DatabaseInsights-vCPU-Hours |
|
| Limitless | DatabaseInsights-ACU-Hours |
|
| Canaries (Synthetics) | Run |
|
| RUM | Events |
|
| Network monitoring | Network Synthetic Monitor |
|
| Internet Monitor (monitored resources) |
|
|
| Internet Monitor (monitored city networks) |
|
Analyze CloudWatch cost and usage data with Amazon Cost and Usage Reports and Athena
Another way to analyze CloudWatch cost and usage data is by using Amazon Cost and Usage Reports with Amazon Athena. Amazon Cost and Usage Reports contain a comprehensive set of cost and usage data. You can create reports that track your costs and usage, and you can publish these reports to an S3 bucket of your choice. You also can download and delete your reports from your S3 bucket. For more information, see What are Amazon Cost and Usage Reports? in the Amazon Cost and Usage Reports User Guide.
Note
There is no charge for using Amazon Cost and Usage Reports. You only pay for storage when you publish your reports to Amazon Simple Storage Service (Amazon S3). For more information, see Quotas and restrictions in the Amazon Cost and Usage Reports User Guide.
Athena is a query service that you can use with Amazon Cost and Usage Reports to analyze cost and usage
data. You can query your reports in your S3 bucket without needing to download them
first. For more information, see What is Amazon Athena? in the
Amazon Athena User Guide. For more information, see What is Amazon Athena?
in the Amazon Athena User Guide. For information about pricing, see
Amazon Athena pricing
The following procedure describes the process for enabling Amazon Cost and Usage Reports and integrating the service with Athena. The procedure contains two example queries that you can use to analyze CloudWatch cost and usage data.
Note
You can use any of the example queries in this document. All of the example queries in this document correspond to a database named costandusagereport, and show results for the month of April and the year 2025. You can change this information. However, before you run a query, make sure that the name of your database matches the name of the database in the query.
To analyze cost and usage data with Amazon Cost and Usage Reports and Athena
-
Enable Amazon Cost and Usage Reports. For more information, see Creating cost and usage reports in the Amazon Cost and Usage Reports User Guide.
Tip
When you create your reports, make sure to select Include resource IDs. Otherwise, your reports won't include the column
line_item_resource_id. This line helps you further identify costs when analyzing cost and usage data. -
Integrate Amazon Cost and Usage Reports with Athena. For more information, see Setting up Athena using Amazon CloudFormation templates in the Amazon Cost and Usage Reports User Guide.
-
Query your cost and usage reports.
Example of Athena query to show CloudWatch costs per month
You can use the following query to show which CloudWatch features generated the most costs for a given month.
SELECT
CASE
-- Metrics
WHEN line_item_usage_type LIKE '%%MetricMonitorUsage%%' THEN 'Metrics (Custom, Detailed monitoring management portal EMF)'
WHEN line_item_usage_type LIKE '%%Requests%%' THEN 'Metrics (API Requests)'
WHEN line_item_usage_type LIKE '%%GMD-Metrics%%' THEN 'Metrics (Bulk API Requests)'
WHEN line_item_usage_type LIKE '%%MetricStreamUsage%%' THEN 'Metric Streams'
-- Contributor Insights
WHEN line_item_usage_type LIKE '%%Contributor%%' THEN 'Contributor Insights'
-- Dashboard
WHEN line_item_usage_type LIKE '%%DashboardsUsageHour%%' THEN 'Dashboards'
-- Alarms
WHEN line_item_usage_type LIKE '%%AlarmMonitorUsage%%' THEN 'Alarms (Standard)'
WHEN line_item_usage_type LIKE '%%HighResAlarmMonitorUsage%%' THEN 'Alarms (High Resolution)'
WHEN line_item_usage_type LIKE '%%MetricInsightAlarmUsage%%' THEN 'Alarms (Metrics Insights)'
WHEN line_item_usage_type LIKE '%%CompositeAlarmMonitorUsage%%' THEN 'Alarms (Composite)'
-- Container Insights with enhanced observability
WHEN (line_item_usage_type LIKE '%%MetricsUsage%%' OR line_item_usage_type LIKE '%%ObservationUsage%%') THEN 'Container Insights (Enhanced Observability)'
-- OpenTelemetry metrics
WHEN line_item_usage_type LIKE '%%CW:OTEL:Bytes%' THEN 'OpenTelemetry Metrics'
-- PromQL
WHEN line_item_usage_type LIKE '%%CW:PromQL:SamplesScanned%%' THEN 'PromQL Queries'
WHEN line_item_usage_type LIKE '%%CW:PromQLAlarmMonitorUsage%%' THEN 'PromQL Alarms'
-- Metrics Centralization
WHEN line_item_usage_type LIKE '%%CW:CentralizedBytes%%' THEN 'Metrics Centralization'
-- Database Insights
WHEN line_item_usage_type LIKE '%%DatabaseInsights%%' THEN 'Database Insights'
-- Logs
WHEN line_item_usage_type LIKE '%%DataProcessing-Bytes%%' THEN 'Logs (Collect - Data Ingestion)'
WHEN line_item_usage_type LIKE '%%DataProcessingIA-Bytes%%' THEN 'Infrequent Access Logs (Collect - Data Ingestion)'
WHEN line_item_usage_type LIKE '%%DataProtection-Bytes%%' THEN 'Logs (Data Protection - Detect and Mask)'
WHEN line_item_usage_type LIKE '%%TimedStorage-ByteHrs%%' THEN 'Logs (Storage - Archival)'
WHEN line_item_usage_type LIKE '%%DataScanned-Bytes%%' THEN 'Logs (Analyze - Logs Insights queries)'
WHEN line_item_usage_type LIKE '%%Logs-LiveTail%%' THEN 'Logs (Analyze - Logs Live Tail)'
-- Vended Logs
WHEN line_item_usage_type LIKE '%%VendedLog-Bytes%%' THEN 'Vended Logs (Delivered to CW)'
WHEN line_item_usage_type LIKE '%%VendedLogIA-Bytes%%' THEN 'Vended Infrequent Access Logs (Delivered to CW)'
WHEN line_item_usage_type LIKE '%%FH-Egress-Bytes%%' THEN 'Vended Logs (Delivered to Data Firehose)'
WHEN (line_item_usage_type LIKE '%%S3-Egress%%') THEN 'Vended Logs (Delivered to S3)'
-- Network Monitoring
WHEN line_item_usage_type LIKE '%%CWNMHybrid-Paid%%' THEN 'Network Monitor'
WHEN line_item_usage_type LIKE '%%InternetMonitor%%' THEN 'Internet Monitor'
-- Other
WHEN line_item_usage_type LIKE '%%Application-Signals%%' THEN 'Application Signals'
WHEN line_item_usage_type LIKE '%%Canary-runs%%' THEN 'Synthetics'
WHEN line_item_usage_type LIKE '%%RUM-event%%' THEN 'RUM'
ELSE 'Others'
END AS UsageType,
-- REGEXP_EXTRACT(line_item_resource_id,'^(?:.+?:){5}(.+)$',1) as ResourceID,
SUM(CAST(line_item_usage_amount AS double)) AS UsageQuantity, SUM(CAST(line_item_unblended_cost AS decimal(16,8))) AS TotalSpend
FROM
costandusagereport
WHERE product_product_name = 'AmazonCloudWatch'
AND year='2025'
AND month='4'
AND line_item_line_item_type NOT IN ('Tax','Credit','Refund','EdpDiscount','Fee','RIFee')
-- AND line_item_usage_account_id = '123456789012' – If you want to filter on a specific account, you can remove this comment at the beginning of the line and specify an AWS account.
GROUP BY
1
ORDER BY TotalSpend DESC,
UsageType;
Example of Athena query to show how CloudWatch features generated costs
You can use the following query to show the results for UsageType
and Operation. This shows you how CloudWatch features generated costs.
The results also show the values for UsageQuantity and
TotalSpend, so that you can see your total usage costs.
Tip
For more information about UsageType, add the following line
to this query:
line_item_line_item_description
This line creates a column called Description.
SELECT bill_payer_account_id as Payer, line_item_usage_account_id as LinkedAccount, line_item_usage_type AS UsageType, line_item_operation AS Operation, line_item_resource_id AS ResourceID, SUM(CAST(line_item_usage_amount AS double)) AS UsageQuantity, SUM(CAST(line_item_unblended_cost AS decimal(16,8))) AS TotalSpend FROMcostandusagereportWHERE product_product_name = 'AmazonCloudWatch'AND year='2025'AND month='4'AND line_item_line_item_type NOT IN ('Tax','Credit','Refund','EdpDiscount','Fee','RIFee') GROUP BY bill_payer_account_id, line_item_usage_account_id, line_item_usage_type, line_item_resource_id, line_item_operation
Optimizing and reducing costs of CloudWatch metrics
Many Amazon Web Services services, such as Amazon Elastic Compute Cloud (Amazon EC2) , Amazon S3, and Amazon Data Firehose, automatically send metrics to CloudWatch at no charge. However, metrics that are grouped in the following categories can incur additional costs:
-
Custom metrics, detailed monitoring, and embedded metrics
-
API requests
-
Metric streams
For more information, see Using Amazon CloudWatch metrics.
Custom metrics
You can create custom metrics to organize data points in any order and at any rate.
All custom metrics are prorated by the hour. They're metered only when they're
sent to CloudWatch. For information about how metrics are priced, see Amazon CloudWatch
Pricing
The following table lists the names of relevant sub-features for CloudWatch metrics. The
table includes the strings for UsageType and Operation,
which can help you analyze and identify metric-related costs.
Note
To get more details about the metrics that are listed in the following table
while you're querying cost and usage data with Athena, match the strings for
Operation with the results that are shown for
line_item_operation.
| CloudWatch sub-feature |
|
|
Purpose |
|---|---|---|---|
|
Custom metrics |
|
|
Custom metrics |
Detailed monitoring |
|
|
Detailed monitoring |
Embedded metrics |
|
|
Logs embedded metrics |
Log filters |
|
|
Log group metric filters |
Detailed monitoring
CloudWatch has two types of monitoring:
-
Basic monitoring
Basic monitoring is free and automatically enabled for all Amazon Web Services services that support the feature.
-
Detailed monitoring
Detailed monitoring incurs costs and adds different enhancements depending on the Amazon Web Services service. For each Amazon Web Services service that supports detailed monitoring, you can choose whether to enable it for that service. For more information, see Basic and detailed monitoring.
Note
Other Amazon Web Services services support detailed monitoring and might refer to this feature using a different name. For example, detailed monitoring for Amazon S3 is referred to as request metrics.
Similar to custom metrics, detailed monitoring is prorated by the hour and metered
only when data is sent to CloudWatch. Detailed monitoring generates costs by the number of
metrics that are sent to CloudWatch. To reduce costs, only enable detailed monitoring when
necessary. For information about how detailed monitoring is priced, see Amazon CloudWatch
Pricing
Example: Athena query
You can use the following query to show which EC2 instances have detailed monitoring enabled.
SELECT bill_payer_account_id as Payer, line_item_usage_account_id as LinkedAccount, line_item_usage_type AS UsageType, line_item_operation AS Operation, line_item_resource_id AS ResourceID, SUM(CAST(line_item_usage_amount AS double)) AS UsageQuantity, SUM(CAST(line_item_unblended_cost AS decimal(16,8))) AS TotalSpend FROMcostandusagereportWHERE product_product_name = 'AmazonCloudWatch'AND year='2025'AND month='4'AND line_item_operation='MetricStorage:AWS/EC2' AND line_item_line_item_type NOT IN ('Tax','Credit','Refund','EdpDiscount','Fee','RIFee') GROUP BY bill_payer_account_id, line_item_usage_account_id, line_item_usage_type, line_item_resource_id, line_item_operation, line_item_line_item_description ORDER BY line_item_operation
Embedded metrics
With the CloudWatch embedded metric format, you can ingest application data as log data, so that you can generate actionable metrics. For more information, see Ingesting high-cardinality logs and generating metrics with the CloudWatch embedded metric format.
Embedded metrics generate costs by the number of logs ingested, number of logs archived, and number of custom metrics generated.
The following table lists the names of relevant sub-features for the CloudWatch embedded
metric format. The table includes the strings for UsageType and
Operation, which can help you analyze and identify costs.
| CloudWatch subfeature |
|
|
Purpose |
|---|---|---|---|
|
Custom metrics |
|
|
Logs embedded metrics |
|
Logs ingestion |
|
|
Uploads a batch of log events to the specified log group or log stream |
|
Logs archival |
|
|
Stores logs per hour and logs per byte in CloudWatch Logs |
To analyze costs, use Amazon Cost and Usage Reports with Athena so that you can identify which metrics are generating costs and determine how the costs are generated.
To make the most of costs generated by the CloudWatch embedded metric format, avoid creating metrics based on high-cardinality dimensions. This way, CloudWatch doesn't create a custom metric for each unique dimension combination. For more information, see Dimensions.
API requests
CloudWatch has the following types of API requests:
-
API requests
-
Bulk (Get)
-
Contributor Insights
-
Bitmap image snapshot
API requests generate costs by the request type and number of metrics requested.
The following table lists the types of API requests and includes the strings for
UsageType and Operation, which can help you analyze
and identify API-related costs.
| API request type |
|
|
Purpose |
|---|---|---|---|
| API requests |
|
|
Retrieves statistics for the specified metrics |
|
|
Lists the specified metrics |
|
|
|
Publishes metric data points to CloudWatch |
|
|
|
Displays details for the specified dashboards |
|
|
|
Lists the dashboards in your account |
|
|
|
Creates or updates a dashboard |
|
|
|
Deletes all specified dashboards |
|
| Bulk (Get) |
|
|
Retrieves CloudWatch metric values |
| Contributor Insights |
|
|
Returns time-series data that's collected by a Contributor Insights rule |
| Bitmap image snapshot |
|
|
Retrieves a snapshot of one or more CloudWatch metrics as a bitmap image |
To analyze costs, use Cost Explorer, and group your results by API Operation.
The billing console shows generic API requests under UsageType Requests. These appear as X.XX USD per 1,000 requests - [region]. This rate applies to all requests with the UsageType Requests, aggregated together, beyond your free tier allowance.
Costs for API requests vary, and you incur costs when you exceed the number of API calls provided to you under the Amazon Free Tier limit.
Note
Only API requests with UsageType Requests are included in the Amazon Free Tier limit. API requests with any other UsageType incur charges from the first call. For more information, see Using the Amazon Free Tier in the Amazon Billing User Guide.
The API requests that typically drive cost are Put and
Get requests.
To monitor API request origins and identify users within your account, enable data events in CloudTrail and analyze recorded events using either:
Amazon CloudWatch Logs with Log Insights
Amazon S3 with Amazon Athena
Note
Data events are not logged automatically by trails and event data stores. Logging data events incurs additional costs. For more information, see Amazon CloudTrail Pricing
For more information, see Logging data events and
Identifying resources driving CloudWatch GetMetricData charges using Amazon CloudTrail
API calls not incurring charges
When you log CloudWatch data events in CloudTrail, you might see more calls than you initiated. This happens because logging CloudWatch data events in CloudTrail captures API actions from internal components. Internal component calls don't incur CloudWatch charges. However, these events count toward your CloudTrail event logging total and may affect CloudTrail charges.
For example, CloudTrail will record GetMetricData calls initiated by a monitoring account to retrieve data from a source account, as well as GetMetricData calls initiated by CloudWatch dashboards to refresh widget data. These API calls do not incur CloudWatch charges.
PutMetricData
Each CloudWatch PutMetricData API call incurs charges. Frequent calls can significantly increase your costs, especially in high-volume monitoring scenarios. To reduce costs,
consider batching multiple metrics in each API call or adjusting your monitoring frequency. For more information, see PutMetricData in the Amazon CloudWatch API Reference.
To make the most of costs that are generated by PutMetricData, batch
more data into your API calls. Depending on your use case, consider using CloudWatch Logs or
the CloudWatch embedded metric format to inject metric data. For more information, see the
following resources:
GetMetricData
The CloudWatch GetMetricData API operation can also significantly increase your costs. Third-party monitoring tools often increase costs when they frequently pull
data to generate insights. To learn more about pricing and best practices for using GetMetricData, see GetMetricData in the Amazon CloudWatch API Reference.
To reduce costs generated by GetMetricData, consider only pulling
data that's monitored and used, or consider pulling data less often. Depending on
your use case, you might consider using metric streams instead of
GetMetricData, so that you can push data in near real time to third
parties at a lower cost. For more information, see the following resources:
GetMetricStatistics
Depending on your use case, you might consider using
GetMetricStatistics instead of GetMetricData. With
GetMetricData, you can retrieve data quickly and at scale. However,
GetMetricStatistics is included under the Amazon Free Tier limit for
up to one million API requests, which can help you reduce costs if you don't need to
retrieve as many metrics and data points per call. For more information, see the
following resources:
-
GetMetricStatistics in the Amazon CloudWatch API Reference
Note
External callers make API calls. For APIs that are supported by CloudTrail data
events (such as GetMetricData and
GetMetricWidgetImage), you can use CloudTrail to identify the
top CloudWatch API callers and potentially mitigate or identify unexpected calls. For
more information, see How to use CloudTrail to analyse your CloudWatch API Usage
CloudWatch metric streams
With CloudWatch metric streams, you can send metrics continuously to Amazon destinations and third-party service provider destinations.
Metric streams generate costs by the number of metric updates. Metric updates always include values for the following statistics:
-
Minimum -
Maximum -
Sample Count -
Sum
For more information, see Statistics that can be streamed.
To analyze costs that are generated by CloudWatch metric streams, use Amazon Cost and Usage Reports with Athena. This way, you can identify which metric streams are generating costs and determine how the costs are generated.
Example: Athena query
You can use the following query to track which metric streams generate costs by Amazon Resource Name (ARN).
SELECT SPLIT_PART(line_item_resource_id,'/',2) AS "Stream Name", line_item_resource_id as ARN, SUM(CAST(line_item_unblended_cost AS decimal(16,2))) AS TotalSpend FROMcostandusagereportWHERE product_product_name = 'AmazonCloudWatch'AND year='2025'AND month='4'AND line_item_line_item_type NOT IN ('Tax','Credit','Refund','EdpDiscount','Fee','RIFee') -- AND line_item_usage_account_id = '123456789012' – If you want to filter on a specific account, you can remove this comment at the beginning of the line and specify an AWS account. AND line_item_usage_type LIKE '%%MetricStreamUsage%%' GROUP BY line_item_resource_id ORDER BY TotalSpend DESC
To reduce costs generated by CloudWatch metric streams, stream only the metrics that bring your business value. You also can stop or pause any metric stream that you're not using.
Optimizing and reducing costs of CloudWatch alarms
With CloudWatch alarms, you can create alarms based on a single metric, alarms based on a Metrics Insights query, and composite alarms which watch other alarms.
Note
Costs for metric and composite alarms are prorated by the hour. You incur costs
for your alarms only while your alarms exist. To optimize cost, be sure not to leave
behind misconfigured or low-value alarms. To help with this, you can automate the
cleanup of CloudWatch alarms that you no longer need. For more information, see Automating Amazon CloudWatch Alarm Cleanup at Scale
Metric alarms
Metric alarms have the following resolution settings:
-
Standard (evaluated every 60 seconds)
-
High resolution (evaluated every 10 seconds)
When you create a metric alarm, your costs are based on your alarm's resolution setting and the number of metrics that your alarm references. For example, a metric alarm that references one metric incurs one alarm-metric cost per hour. For more information, see Using Amazon CloudWatch alarms.
If you create a metric alarm that contains a metric math expression, which references multiple metrics, you incur a cost for each alarm-metric that's referenced in the metric math expression. For information about how to create a metric alarm that contains a metric math expression, see Creating a CloudWatch alarm based on a metric math expression.
If you create an anomaly detection alarm, where your alarm analyzes past metric data to create a model of expected values, you incur a cost for each alarm-metric that's referenced in your alarm plus two additional metrics, one for the upper and lower band metrics that the anomaly detection model creates. For information about how to create an anomaly detection alarm, see Creating a CloudWatch alarm based on anomaly detection.
Metrics Insights query alarms
Metric Insights query alarms are a specific type of metric alarm, only available with standard resolution (evaluated every 60 seconds).
When you create a Metric Insights query alarm, your costs are based on the number
of metrics analyzed by the query that your alarm references. For example, a Metric
Insights query alarm that references a query whose filter matches ten metrics incurs
ten metrics analyzed cost per hour. For more information, see the pricing example on
Amazon CloudWatch
Pricing
If you create an alarm that contains both a Metrics Insights query and a metric math expression, it is reported as a Metrics Insights query alarm. If your alarm contains a metric math expression which references other metrics in addition to the metrics analyzed by the Metrics Insights query, you incur an additional cost for each alarm-metric that's referenced in the metric math expression. For information about how to create a metric alarm that contains a metric math expression, see Creating a CloudWatch alarm based on a metric math expression.
Composite alarms
Composite alarms contain rule expressions that specify how they should evaluate the states of other alarms to determine their own states. Composite alarms incur a standard cost per hour, regardless of how many other alarms they evaluate. Alarms that composite alarms reference in rule expressions incur separate costs. For more information, see Creating a composite alarm.
Alarm usage types
The following table lists the names of relevant sub-features for CloudWatch alarms. The
table includes the strings for UsageType, which can help you analyze
and identify alarm-related costs.
| CloudWatch sub-feature |
|
|---|---|
| Standard metric alarm |
|
| High-resolution metric alarm |
|
| Metrics Insights query alarm |
|
| Composite alarm |
|
Reducing alarm costs
To optimize costs generated by metric math alarms that aggregate four or more metrics, you can aggregate data before the data is sent to CloudWatch. This way, you can create an alarm for a single metric instead of an alarm that aggregates data for multiple metrics. For more information, see Publishing custom metrics.
To optimize costs generated by Metrics Insights query alarms, you can ensure that the filter used for the query matches only the metrics that you want to monitor.
The best way to reduce costs is to remove all unnecessary or unused alarms. For example, you can delete alarms that evaluate metrics emitted by Amazon resources that no longer exist.
Example of using DescribeAlarms to check for alarms in INSUFFICIENT_DATA state
If you delete a resource, but not the metric alarms that the resource
emits, the alarms still exist and typically will go into the
INSUFFICIENT_DATA state. To check for alarms that are in
the INSUFFICIENT_DATA state, use the following Amazon Command Line Interface
(Amazon CLI) command.
aws cloudwatch describe-alarms –state-value INSUFFICIENT_DATA
For more information, see Automating Amazon CloudWatch Alarm Cleanup at Scale
Other ways to reduce costs include the following:
-
Make sure to create alarms for the correct metrics.
-
Make sure that you don't have any alarms enabled in Regions where you're not working.
-
Remember that, although composite alarms reduce noise, they also generate additional costs.
-
When deciding whether to create a standard alarm or high-resolution alarm, consider your use case and the value that each type of alarm brings.
Optimizing and reducing costs of CloudWatch Container Insights
CloudWatch Container Insights offers both standard and enhanced observability features for monitoring containerized applications in Amazon ECS and Amazon EKS. CloudWatch Container Insights leverages the embedded metric format to ingest telemetry from your container environments.
Container Insights with standard observability:
Standard Container Insights collects and visualizes metrics aggregated at the cluster and node levels. You can get started with standard mode of Container Insights using either the CloudWatch agent or the Amazon Distro for Open Telemetry (ADOT). Using ADOT enables you to customize which metrics and dimensions are sent to CloudWatch.
Metrics in Container Insights are treated as "embedded metrics". Costs associated with
these metrics are reflected in the usage types MetricStorage:AWS/Logs-EMF
and DataProcessing-Bytes. For detailed pricing information, see the
Embedded Metrics section at Amazon CloudWatch
pricing
Container Insights with enhanced observability:
Detailed visibility comes with Container Insights with enhanced observability, which
delivers granular telemetry up to the pod and container levels in your applications.
Similar to standard Container Insights, enhanced observability also comes with a
standard set of critical metrics where you can get started by using the CloudWatch
Observability add-on running on the CloudWatch agent. Container Insights offers enhanced
observability with a new observation-based pricing in order to ensure cost effective
bills justifying the benefit. See Amazon CloudWatch pricing
Here are the following UsageType and Operation associated with this Container Inisghts with enhanced observability:
| CloudWatch sub-feature |
|
|
|---|---|---|
| Container Insights with enhanced observability for Amazon EKS |
|
|
| Container Insights with enhanced observability for Amazon ECS |
|
|
Optimizing and reducing costs of CloudWatch Database Insights
CloudWatch Database Insights offers both standard and enhanced observability features for monitoring Amazon Aurora databases at both the instance and fleet level;. CloudWatch Database Insights consolidates logs and metrics from your applications, your databases, and the operating systems on which they run into a unified view in the console.
Database Insights Standard mode: Standard Database Insights is part of the Amazon Web Services China Region Free Tier and provides a rolling 7 days of performance data history for the database load metric.
Database Insights Advanced mode: Advanced Database Insights consolidates database metrics, SQL query analytics, and logs for Amazon Aurora and RDS databases into a unified experience in CloudWatch. Pricing is based on the amount of compute resources used by the monitored databases.
For details about how Database Insights is priced and pricing examples, see Amazon CloudWatch
pricing
Here are the UsageTypes and Operations associated with Database Insights:
| UsageType |
|
|
|
|---|---|---|---|
| DatabaseInsights-vCPU-Hours |
|
|
|
| DatabaseInsights-ACU-Hours |
|
|
|
| DatabaseInsights-vCPU-Hours |
|
|
|
| DatabaseInsights-ACU-Hours |
|
|
|
| DatabaseInsights-ACU-Hours | Aurora-PostgreSQL:Limitless |
|
Aurora-PostgreSQL |
Optimizing and reducing costs of CloudWatch Logs
Amazon CloudWatch Logs has the following log types:
-
Custom logs (logs that you create for your applications)
-
Vended logs (logs that other Amazon Web Services services, such as Amazon Virtual Private Cloud (Amazon VPC) and Amazon Route 53, create on your behalf)
For more information about vended logs, see Enabling logging from certain Amazon services in the Amazon CloudWatch Logs User Guide.
Custom and vended logs generate costs based on the number of logs that are collected, stored, and analyzed. Separately, vended logs generate costs for delivery to Amazon S3 and Firehose.
The following table lists the names of the CloudWatch Logs features and names of relevant
sub-features. The table includes the strings for UsageType and
Operation, which can help you analyze and identify log-related costs.
| CloudWatch Logs feature | CloudWatch Logs sub-feature |
|
|
Purpose |
|---|---|---|---|---|
| Custom logs | Collect (data ingestion for Standard log class) |
|
|
Uploads a batch of logs to a specific log stream in a Standard class log group. |
| Collect (data ingestion for Infrequent Access log class) |
|
|
Uploads a batch of logs to a specific log stream in an Infrequent Access class log group. | |
| Detect and mask (data protection) |
|
|
Detects and masks protected data in log events. | |
| Store (archive) |
|
|
Stores logs per hour and logs per byte in CloudWatch Logs. | |
| Analyze (Logs Insights queries) |
|
|
Logs data scanned by CloudWatch Logs Insights queries | |
| Analyze (Logs Live Tail) |
|
|
Logs analyzed during a CloudWatch Logs Live Tail session | |
| Vended logs | Delivery (CloudWatch Logs Standard log class) |
|
|
Uploads a batch of logs to a specific log stream in a log group in the Standard log class. |
| Delivery (CloudWatch Logs Infrequent Access log class) |
|
|
Uploads a batch of logs to a specific log stream in a log group in the Infrequent Access log class. | |
|
Delivery (Amazon S3) |
|
|
Uploads a batch of vended logs to a specific S3 bucket |
|
|
Delivery (Amazon S3) in Parquet format |
|
|
Perform Parquet conversion on logs delivered to Amazon S3 |
|
Delivery (Firehose) |
|
|
Uploads a batch of vended logs to Amazon Data Firehose |
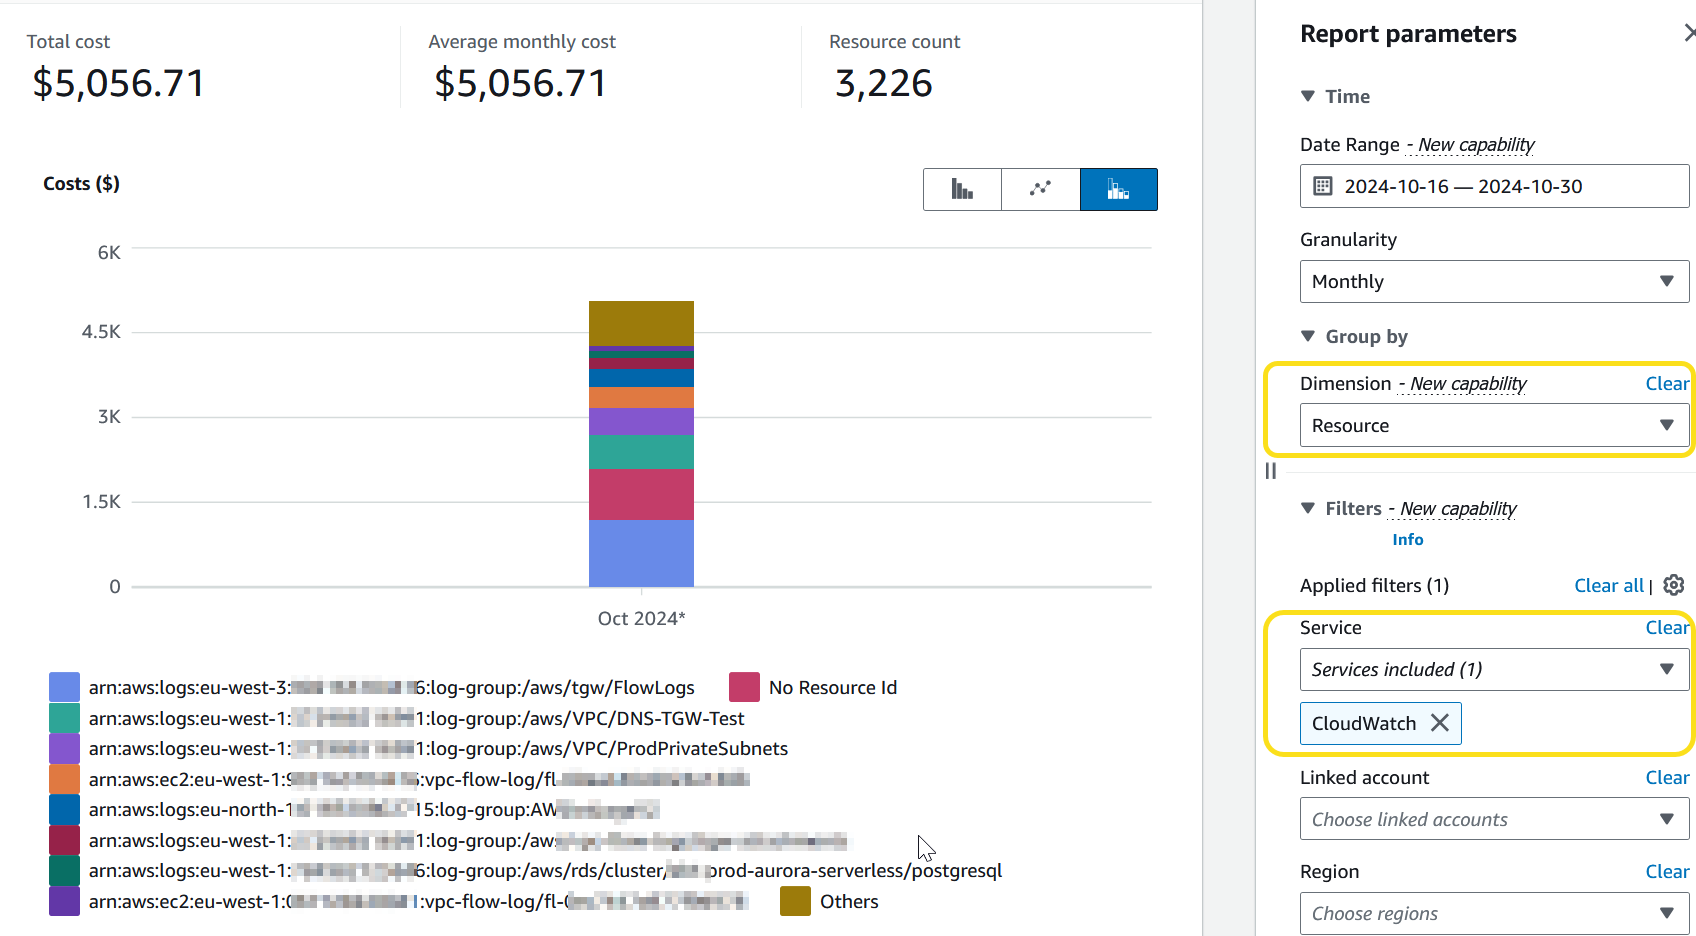
To analyze costs, use Amazon Cost Explorer Service or Amazon Cost and Usage Reports with Athena. With either method, you can identify which logs are generating costs and determine how the costs are generated.
Using Amazon Cost Explorer Service
Select CloudWatch for the Service filter and select Resource for the Dimension. When you select Resource as the dimension in Cost Explorer Service you can see only the past 14 days of usage.
Using Amazon Athena query to track logs that generate costs
You can use the following query to track which logs generate costs by resource ID.
SELECT line_item_resource_id AS ResourceID, line_item_usage_type AS Operation, SUM(CAST(line_item_unblended_cost AS decimal(16,8))) AS TotalSpend FROMcostandusagereportWHERE product_product_name = 'AmazonCloudWatch' AND year='2025' AND month='4' AND line_item_operation IN ('PutLogEvents','HourlyStorageMetering','StartQuery','LogDelivery','StartLiveTail','ParquetConversion') AND line_item_line_item_type NOT IN ('Tax','Credit','Refund','EdpDiscount','Fee','RIFee') GROUP BY line_item_resource_id, line_item_usage_type ORDER BY TotalSpend DESC
To make the most of costs that are generated by CloudWatch Logs, consider the following:
-
Identify top log groups by spend per operation by using the previous query.
-
Log only the events that bring your business value and choose an efficient log syntax. A verbose log syntax drives volume and thus cost. This helps you generate lower costs for ingestion.
-
Change your log retention settings, so that you generate lower costs for storage. For more information, see Change log data retention in CloudWatch Logs in the Amazon CloudWatch Logs User Guide.
-
Consider using the Infrequent Access log class where appropriate. Infrequent Access logs offers fewer features than Standard class. Determine whether you need the additional features of Standard log class and understand the difference between both classes. For more information, see the blog article New CloudWatch Logs log class for infrequent access logs at a reduced price
. While the Infrequent Access class supports fewer features, it is suitable for a majority of use cases. -
Run queries that CloudWatch Logs Insights automatically saves in your history. This way, you generate fewer costs for analysis. For more information, see View running queries or query history in the Amazon CloudWatch Logs User Guide.
-
Use the CloudWatch agent to collect system and application logs and send them to CloudWatch. This way, you can collect only the log events that meet your criteria. For more information, see Amazon CloudWatch Agent adds Support for Log Filter Expressions
.
To reduce costs for vended logs, consider your use case, and then determine whether your logs should be sent to CloudWatch or Amazon S3. For more information, see Logs sent to Amazon S3 in the Amazon CloudWatch Logs User Guide.
Tip
If you want to use metric filters, subscription filters, CloudWatch Logs Insights, and Contributor Insights, send vended logs to CloudWatch.
Alternatively, if you're working with VPC Flow Logs and using them for auditing and compliance purposes, send vended logs to Amazon S3.
For information about how to track charges that are generated by publishing VPC
Flow Logs to S3 buckets, see Using Amazon Cost and Usage Reports and cost allocation tags to understand VPC FLow Logs data
ingestion in Amazon S3
For additional information about how to make the most of costs that are generated by
CloudWatch Logs, see Which log group is causing a sudden increase in my CloudWatch Logs bill?