Monitoring backtracking for an Aurora MySQL DB cluster
You can view backtracking information and monitor backtracking metrics for a DB cluster.
To view backtracking information and monitor backtracking metrics using the console
Sign in to the Amazon Web Services Management Console and open the Amazon RDS console at https://console.amazonaws.cn/rds/
. -
Choose Databases.
-
Choose the DB cluster name to open information about it.
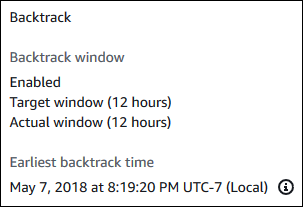
The backtrack information is in the Backtrack section.

When backtracking is enabled, the following information is available:
-
Target window – The current amount of time specified for the target backtrack window. The target is the maximum amount of time that you can backtrack if there is sufficient storage.
-
Actual window – The actual amount of time you can backtrack, which can be smaller than the target backtrack window. The actual backtrack window is based on your workload and the storage available for retaining backtrack change records.
-
Earliest backtrack time – The earliest possible backtrack time for the DB cluster. You can't backtrack the DB cluster to a time before the displayed time.
-
-
Do the following to view backtracking metrics for the DB cluster:
-
In the navigation pane, choose Instances.
-
Choose the name of the primary instance for the DB cluster to display its details.
-
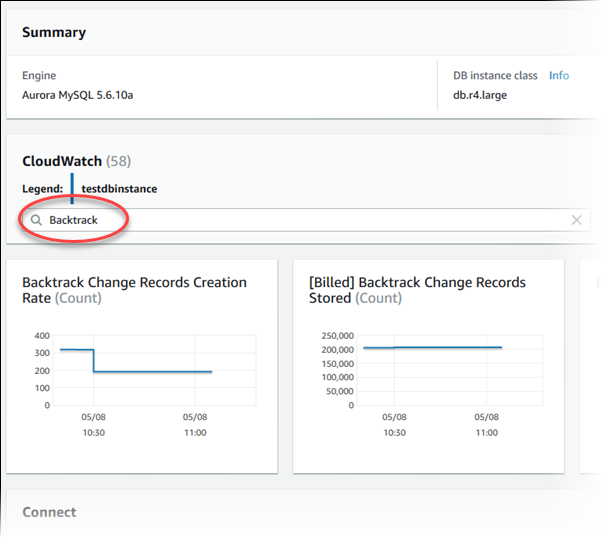
In the CloudWatch section, type
Backtrackinto the CloudWatch box to show only the Backtrack metrics.
The following metrics are displayed:
-
Backtrack Change Records Creation Rate (Count) – This metric shows the number of backtrack change records created over five minutes for your DB cluster. You can use this metric to estimate the backtrack cost for your target backtrack window.
-
[Billed] Backtrack Change Records Stored (Count) – This metric shows the actual number of backtrack change records used by your DB cluster.
-
Backtrack Window Actual (Minutes) – This metric shows whether there is a difference between the target backtrack window and the actual backtrack window. For example, if your target backtrack window is 2 hours (120 minutes), and this metric shows that the actual backtrack window is 100 minutes, then the actual backtrack window is smaller than the target.
-
Backtrack Window Alert (Count) – This metric shows how often the actual backtrack window is smaller than the target backtrack window for a given period of time.
Note
The following metrics might lag behind the current time:
-
Backtrack Change Records Creation Rate (Count)
-
[Billed] Backtrack Change Records Stored (Count)
-
-
The following procedure describes how to view backtrack information for a DB cluster using the Amazon CLI.
To view backtrack information for a DB cluster using the Amazon CLI
-
Call the describe-db-clusters Amazon CLI command and supply the following values:
-
--db-cluster-identifier– The name of the DB cluster.
The following example lists backtrack information for
sample-cluster.For Linux, macOS, or Unix:
aws rds describe-db-clusters \
    --db-cluster-identifier sample-cluster
For Windows:
aws rds describe-db-clusters ^ --db-cluster-identifier sample-cluster -
To view backtrack information for a DB cluster using the Amazon RDS API, use the
DescribeDBClusters operation.
This operation returns backtrack information for the DB cluster specified in
the DBClusterIdentifier value.