Tuning memory parameters for Aurora PostgreSQL
In Amazon Aurora PostgreSQL, you can use several parameters that control the amount of memory used for various processing tasks. If a task takes more memory than the amount set for a given parameter, Aurora PostgreSQL uses other resources for processing, such as by writing to disk. This can cause your Aurora PostgreSQL DB cluster to slow or potentially halt, with an out-of-memory error.
The default setting for each memory parameter can usually handle its intended processing tasks. However, you can also tune your Aurora PostgreSQL DB cluster's memory-related parameters. You do this tuning to ensure that enough memory is allocated for processing your specific workload.
Following, you can find information about parameters that control memory management. You can also learn how to assess memory utilization.
Checking and setting parameter values
The parameters that you can set to manage memory and assess your Aurora PostgreSQL DB cluster's memory usage include the following:
work_mem– Specifies the amount of memory that the Aurora PostgreSQL DB cluster uses for internal sort operations and hash tables before it writes to temporary disk files.log_temp_files– Logs temporary file creation, file names, and sizes. When this parameter is turned on, a log entry is stored for each temporary file that gets created. Turn this on to see how frequently your Aurora PostgreSQL DB cluster needs to write to disk. Turn it off again after you've gathered information about your Aurora PostgreSQL DB cluster's temporary file generation, to avoid excessive logging.logical_decoding_work_mem– Specifies the amount of memory (in kilobytes) to be used by each internal reorder buffer before spilling to disk. This memory is used for Logical decoding, which is the process to create a replica. It is done by converting data from the write-ahead log (WAL) file to the logical streaming output needed by the target.The value of this parameter creates a single buffer of the size specified for each replication connection. By default, it's 65536 KB. After this buffer is filled, the excess is written to disk as a file. To minimize disk activity, you can set the value of this parameter to a much higher value than that of
work_mem.
These are all dynamic parameters, so you can change them for the current session. To do this,
connect to the Aurora PostgreSQL DB cluster
with psql and using the
SET statement, as shown following.
SET parameter_name TO parameter_value;Session settings last for the duration of the session only. When the session ends, the
parameter reverts to its setting in the DB cluster parameter
group.
Before changing any parameters,
first check the current values by querying the pg_settings table, as
follows.
SELECT unit, setting, max_val
   FROM pg_settings WHERE name='parameter_name';
For example, to find the value of the work_mem parameter, connect to the
Aurora PostgreSQL DB cluster's writer instance and run the following query.
SELECT unit, setting, max_val, pg_size_pretty(max_val::numeric) FROM pg_settings WHERE name='work_mem';unit | setting | max_val | pg_size_pretty ------+----------+-----------+---------------- kB | 1024 | 2147483647| 2048 MB (1 row)
Changing parameter settings so that they persist requires using a custom DB cluster parameter group.
After exercising your Aurora PostgreSQL DB cluster
with different values for these parameters using the SET statement,
you can create a custom parameter group and apply to your Aurora PostgreSQL DB cluster.
For more information, see Parameter groups for Amazon Aurora.
Understanding the working memory parameter
The working memory parameter (work_mem) specifies the maximum amount of memory that Aurora PostgreSQL can use
to process complex queries. Complex queries include those that involve sorting or grouping operations—in other words, queries that
use the following clauses:
ORDER BY
DISTINCT
GROUP BY
JOIN (MERGE and HASH)
The query planner indirectly affects how your Aurora PostgreSQL DB cluster uses working memory.
The query planner generates execution plans for processing SQL statements. A given plan might
break up a complex query into multiple units of work that can be run in parallel. When
possible, Aurora PostgreSQL uses the amount of memory specified in the work_mem
parameter for each session before writing to disk for each parallel process.
Multiple database users running multiple operations concurrently and generating multiple units of work in parallel can exhaust your Aurora PostgreSQL DB cluster's allocated working memory. This can lead to excessive temporary file creation and disk I/O, or worse, it can lead to an out-of-memory error.
Identifying temporary file use
Whenever the memory required to process queries exceeds the value specified in the
work_mem parameter, the working data is offloaded to disk
in a temporary file. You can see how often this occurs by turning on the
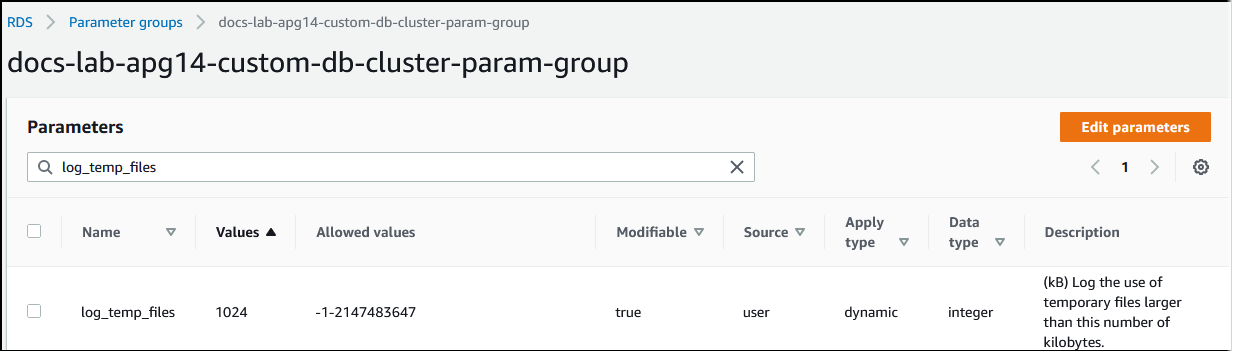
log_temp_files parameter. By default, this parameter is off (it's set to
-1). To capture all temporary file information, set this parameter to 0. Set log_temp_files
to any other positive integer to capture temporary file information for files equal to or greater than that
amount of data (in kilobytes). In the following image, you can see an example from Amazon Web Services Management Console.
After configuring temporary file logging, you can test with your own workload to see if your working memory setting is sufficient. You can also simulate a workload by using pgbench, a simple benchmarking application from the PostgreSQL community.
The following example initializes (-i) pgbench by creating the
necessary tables and rows for running the tests. In this example, the scaling factor
(-s 50) creates 50 rows in the pgbench_branches table, 500 rows
in pgbench_tellers, and 5,000,000 rows in the pgbench_accounts
table in the labdb database.
pgbench -U postgres -h your-cluster-instance-1.111122223333.aws-regionrds.amazonaws.com -p 5432 -i -s 50 labdb
Password:
dropping old tables...
NOTICE:  table "pgbench_accounts" does not exist, skipping
NOTICE:  table "pgbench_branches" does not exist, skipping
NOTICE:  table "pgbench_history" does not exist, skipping
NOTICE:  table "pgbench_tellers" does not exist, skipping
creating tables...
generating data (client-side)...
5000000 of 5000000 tuples (100%) done (elapsed 15.46 s, remaining 0.00 s)
vacuuming...
creating primary keys...
done in 61.13 s (drop tables 0.08 s, create tables 0.39 s, client-side generate 54.85 s, vacuum 2.30 s, primary keys 3.51 s)
After initializing the environment, you can run the benchmark for a specific time (-T) and the number of
clients (-c). This example also uses the -d option to output debugging information as the transactions are processed by
the Aurora PostgreSQL DB cluster.
pgbench -h -U postgresyour-cluster-instance-1.111122223333.aws-regionrds.amazonaws.com -p 5432 -d -T 60 -c 10labdbPassword:*******pgbench (14.3) starting vacuum...end. transaction type: <builtin: TPC-B (sort of)> scaling factor: 50 query mode: simple number of clients: 10 number of threads: 1 duration: 60 s number of transactions actually processed: 1408 latency average = 398.467 ms initial connection time = 4280.846 ms tps = 25.096201 (without initial connection time)
For more information about pgbench, see pgbench
You can use the psql metacommand command (\d) to list the relations such as
tables, views, and indexes created by pgbench.
labdb=>\d pgbench_accountsTable "public.pgbench_accounts" Column | Type | Collation | Nullable | Default ----------+---------------+-----------+----------+--------- aid | integer | | not null | bid | integer | | | abalance | integer | | | filler | character(84) | | | Indexes: "pgbench_accounts_pkey" PRIMARY KEY, btree (aid)
As shown in the output, the pgbench_accounts table is indexed on the
aid column. To ensure that this next query uses working memory, query any
nonindexed column, such as that shown in the following example.
postgres=>SELECT * FROM pgbench_accounts ORDER BY bid;
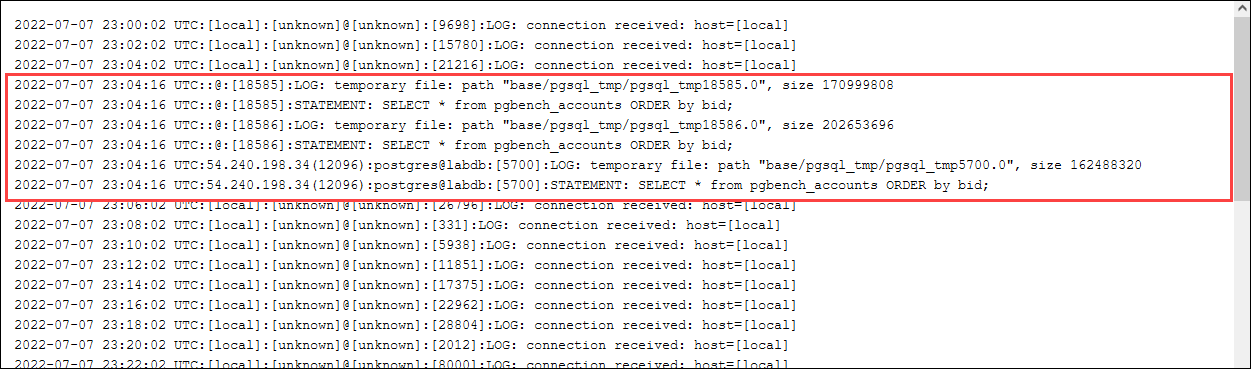
Check the log for the temporary files. To do so, open the Amazon Web Services Management Console, choose the Aurora PostgreSQL
DB cluster instance, and then choose the Logs & Events tab. View
the logs in the console or download for further analysis. As shown in the following image,
the size of the temporary files needed to process the query indicates that you should
consider increasing the amount specified for the work_mem parameter.
You can configure this parameter differently for individuals and groups, based on your
operational needs. For example, you can set the work_mem parameter to 8 GB for
the role named dev_team.
postgres=>ALTER ROLEdev_teamSET work_mem=‘8GB';
With this setting for work_mem, any role that's a member of the dev_team role is allotted up to 8 GB of working memory.
Using indexes for faster response time
If your queries are taking too long to return results, you can verify that your indexes are being used as expected. First,
turn on \timing, the psql metacommand, as follows.
postgres=>\timing on
After turning on timing, use a simple SELECT statement.
postgres=>SELECT COUNT(*) FROM (SELECT * FROM pgbench_accounts ORDER BY bid) AS accounts;count ------- 5000000 (1 row) Time: 3119.049 ms (00:03.119)
As shown in the output, this query took just over 3 seconds to complete. To improve the
response time, create an index on pgbench_accounts, as follows.
postgres=>CREATE INDEX ON pgbench_accounts(bid);CREATE INDEX
Rerun the query, and notice the faster response time. In this example, the query completed about 5 times faster, in about half a second.
postgres=>SELECT COUNT(*) FROM (SELECT * FROM pgbench_accounts ORDER BY bid) AS accounts;count ------- 5000000 (1 row) Time: 567.095 ms
Adjusting working memory for logical decoding
Logical replication has been available in all versions of Aurora PostgreSQL
since its introduction in PostgreSQL version 10. When you configure logical replication,
you can also set the logical_decoding_work_mem parameter to specify the amount of memory that the
logical decoding process can use for the decoding and streaming process.
During logical decoding, write-ahead log (WAL) records are converted to SQL statements that
are then sent to another target for logical replication or another task. When a transaction is
written to the WAL and then converted, the entire transaction must fit into the value
specified for logical_decoding_work_mem. By default, this parameter is set to 65536 KB.
Any overflow is written to disk. This means that it must be reread from the disk before it
can be sent to its destination, thus slowing the overall process.
You can assess the amount of transaction overflow in your current workload at a specific point
in time by using the aurora_stat_file function as shown in the following example.
SELECT split_part (filename, '/', 2) AS slot_name, count(1) AS num_spill_files, sum(used_bytes) AS slot_total_bytes, pg_size_pretty(sum(used_bytes)) AS slot_total_size FROM aurora_stat_file() WHERE filename like '%spill%' GROUP BY 1;slot_name | num_spill_files | slot_total_bytes | slot_total_size ------------+-----------------+------------------+----------------- slot_name | 590 | 411600000 | 393 MB (1 row)
This query returns the count and size of spill files on your Aurora PostgreSQL DB cluster when the query is invoked. Longer running workloads might not have any spill files on disk yet. To profile long-running workloads, we recommend that you create a table to capture the spill file information as the workload runs. You can create the table as follows.
CREATE TABLE spill_file_tracking AS
    SELECT now() AS spill_time,*
    FROM aurora_stat_file()
    WHERE filename LIKE '%spill%';
To see how spill files are used during logical replication, set up a publisher and subscriber
and then start a simple replication. For more information, see Setting up logical replication for your Aurora PostgreSQL DB cluster. With replication under
way, you can create a job that captures the result set from the
aurora_stat_file() spill file function, as follows.
INSERT INTO spill_file_tracking
  SELECT now(),*
  FROM aurora_stat_file()
  WHERE filename LIKE '%spill%';
Use the following psql command to run the job once per second.
\watch 0.5
As the job is running, connect to the writer instance from another psql session. Use the following series of statements to run a workload that exceeds the memory configuration and causes Aurora PostgreSQL to create a spill file.
labdb=>CREATE TABLE my_table (a int PRIMARY KEY, b int);CREATE TABLElabdb=>INSERT INTO my_table SELECT x,x FROM generate_series(0,10000000) x;INSERT 0 10000001labdb=>UPDATE my_table SET b=b+1;UPDATE 10000001
These statements take several minutes to complete. When finished, press the Ctrl key and the C key together to stop the monitoring function. Then use the following command to create a table to hold the information about the Aurora PostgreSQL DB cluster's spill file usage.
SELECT spill_time, split_part (filename, '/', 2) AS slot_name, count(1) AS spills, sum(used_bytes) AS slot_total_bytes, pg_size_pretty(sum(used_bytes)) AS slot_total_size FROM spill_file_tracking GROUP BY 1,2 ORDER BY 1;spill_time | slot_name | spills | slot_total_bytes | slot_total_size ------------------------------+-----------------------+--------+------------------+----------------- 2022-04-15 13:42:52.528272+00 | replication_slot_name | 1 | 142352280 | 136 MB 2022-04-15 14:11:33.962216+00 | replication_slot_name | 4 | 467637996 | 446 MB 2022-04-15 14:12:00.997636+00 | replication_slot_name | 4 | 569409176 | 543 MB 2022-04-15 14:12:03.030245+00 | replication_slot_name | 4 | 569409176 | 543 MB 2022-04-15 14:12:05.059761+00 | replication_slot_name | 5 | 618410996 | 590 MB 2022-04-15 14:12:07.22905+00 | replication_slot_name | 5 | 640585316 | 611 MB (6 rows)
The output shows that running the example created five spill files that used 611 MB of memory. To avoid
writing to disk, we recommend setting the logical_decoding_work_mem parameter to the next highest
memory size, 1024.