Using Amazon CloudWatch metrics to analyze resource usage for Aurora PostgreSQL
Aurora automatically sends metric data to CloudWatch in 1-minute periods. You can analyze resource usage for Aurora PostgreSQL using CloudWatch metrics. You can evaluate the network throughput and the network usage with the metrics.
Evaluating network throughput with CloudWatch
When your system usage approaches the resource limits for your instance type, the processing can slow down. You can use CloudWatch Logs Insights to monitor your storage resource usage and ensure that sufficient resources are available. When needed, you can modify the DB instance to a larger instance class.
Aurora storage processing may be slow because of:
-
Insufficient network bandwidth between the client and DB instance.
-
Insufficient network bandwidth to the storage subsystem.
-
A workload that is large for your instance type.
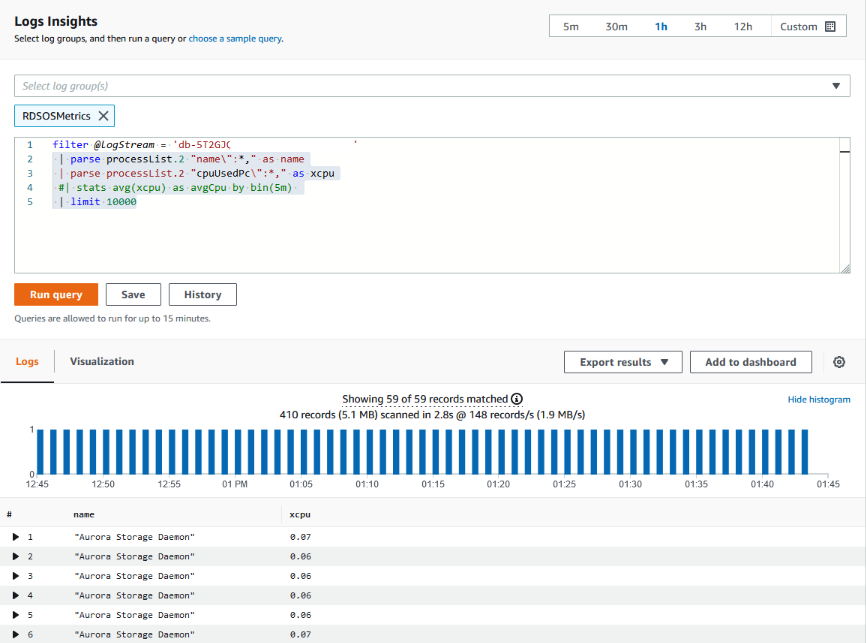
You can query CloudWatch Logs Insights to generate a graph of Aurora storage resource
usage to monitor the resources. The graph shows the CPU utilization and metrics to help
you decide whether to scale up to a larger instance size. For information about the
query syntax for CloudWatch Logs Insights, see CloudWatch Logs Insights query syntax
To use CloudWatch, you need to export your Aurora PostgreSQL log files to CloudWatch. You can also modify your existing cluster to export logs to CloudWatch. For information about exporting logs to CloudWatch, see Turning on the option to publish logs to Amazon CloudWatch.
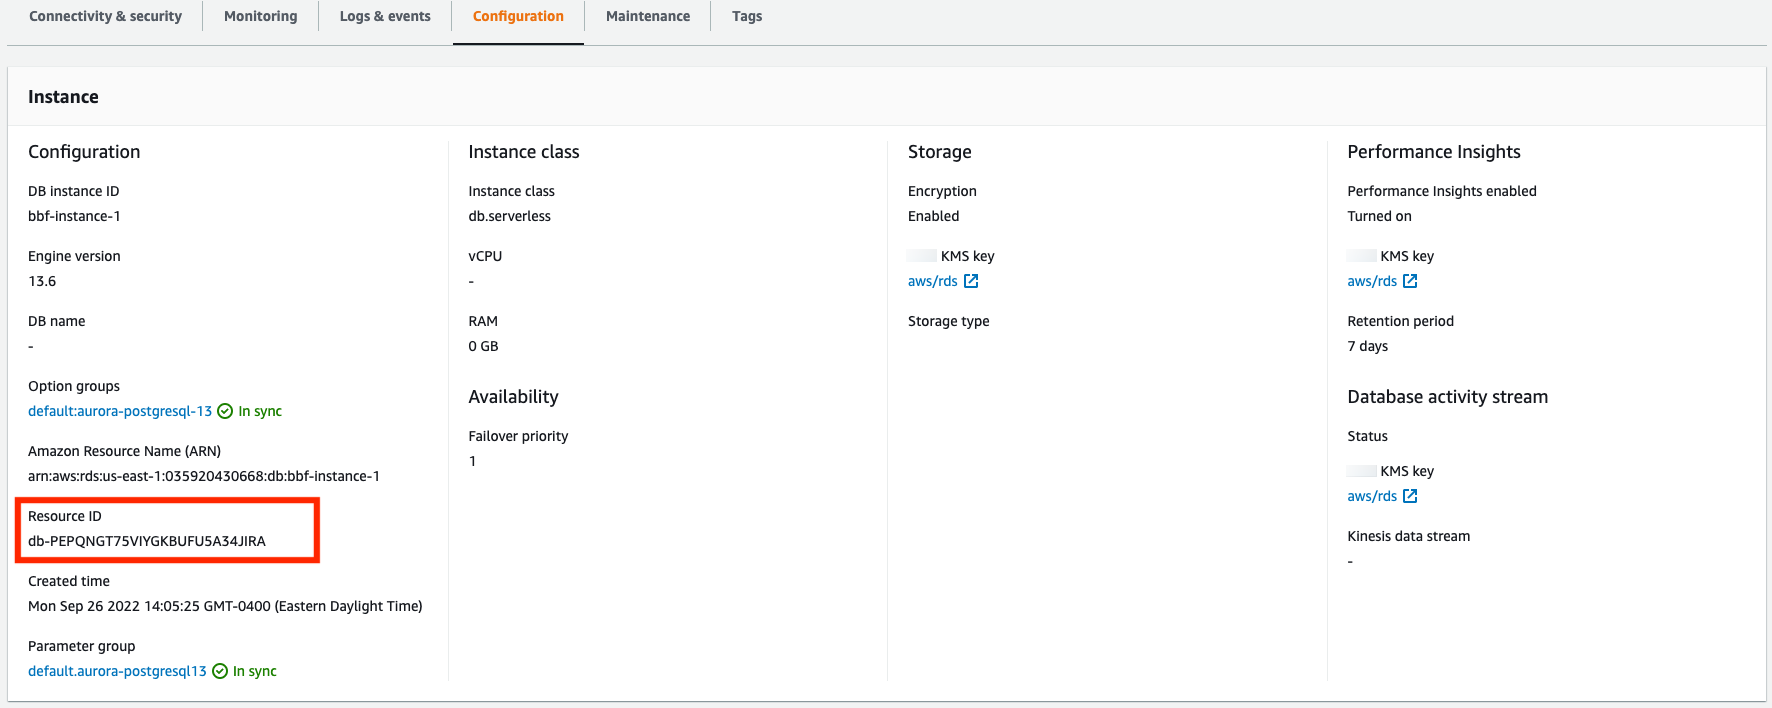
You need the Resource ID of your DB instance to query the CloudWatch Logs Insights. The Resource ID is available in the Configuration tab in your console:
To query your log files for resource storage metrics:
Open the CloudWatch console at https://console.amazonaws.cn/cloudwatch/
. The CloudWatch overview home page appears.
-
If necessary, change the Amazon Web Services Region. In the navigation bar, choose the Amazon Web Services Region where your Amazon resources are located. For more information, see Regions and endpoints.
-
In the navigation pane, choose Logs and then Logs Insights.
The Logs Insights page appears.
-
Select the log files from the drop-down list to analyze.
-
Enter the following query in the field, replacing
<resource
                        ID>
with the resource ID of your DB cluster:filter @logStream = <resource ID> | parse @message "\"Aurora Storage Daemon\"*memoryUsedPc\":*,\"cpuUsedPc\":*," as a,memoryUsedPc,cpuUsedPc | display memoryUsedPc,cpuUsedPc #| stats avg(xcpu) as avgCpu by bin(5m) | limit 10000 -
Click Run query.
The storage utilization graph is displayed.
The following image provides the Logs Insights page and the graph display.
Evaluating DB instance usage for Aurora PostgreSQL with CloudWatch metrics
You can use CloudWatch metrics to watch your instance throughput and discover if your instance class provides sufficient resources for your applications. For information about your DB instance class limits, go to Hardware specifications for DB instance classes for Aurora and locate the specifications for your DB instance class to find your network performance.
If your DB instance usage is near the instance class limit, then performance may begin to slow. The CloudWatch metrics can confirm this situation so you can plan to manually scale-up to a larger instance class.
Combine the following CloudWatch metrics values to find out if you are nearing the instance class limit:
-
NetworkThroughput – The amount of network throughput received and transmitted by the clients for each instance in the Aurora DB cluster. This throughput value doesn't include network traffic between instances in the DB cluster and the cluster volume.
-
StorageNetworkThroughput – The amount of network throughput received and sent to the Aurora storage subsystem by each instance in the Aurora DB cluster.
Add the NetworkThroughput to the StorageNetworkThroughput to find the network throughput received from and sent to the Aurora storage subsystem by each instance in your Aurora DB cluster. The instance class limit for your instance should be greater than the sum of these two combined metrics.
You can use the following metrics to review additional details of the network traffic from your client applications when sending and receiving:
-
NetworkReceiveThroughput – The amount of network throughput received from clients by each instance in the Aurora PostgreSQL DB cluster. This throughput doesn't include network traffic between instances in the DB cluster and the cluster volume.
-
NetworkTransmitThroughput – The amount of network throughput sent to clients by each instance in the Aurora DB cluster. This throughput doesn't include network traffic between instances in the DB cluster and the cluster volume.
-
StorageNetworkReceiveThroughput – The amount of network throughput received from the Aurora storage subsystem by each instance in the DB cluster.
-
StorageNetworkTransmitThroughput – The amount of network throughput sent to the Aurora storage subsystem by each instance in the DB cluster.
Add all of these metrics together to evaluate how your network usage compares to the instance class limit. The instance class limit should be greater than the sum of these combined metrics.
The network limits and CPU utilization for storage are mutual. When the network throughput increases, then the CPU utilization also increases. Monitoring the CPU and network usage provides information about how and why the resources are being exhausted.
To help minimize network usage, you can consider:
-
Using a larger instance class.
-
Using
pg_partmanpartitioning strategies. -
Dividing the write requests in batches to reduce overall transactions.
-
Directing the read-only workload to a read-only instance.
-
Deleting any unused indexes.
-
Checking for bloated objects and VACUUM. In the case of severe bloat, use the PostgreSQL extension
pg_repack. For more information aboutpg_repack, see Reorganize tables in PostgreSQL databases with minimal locks.