Viewing OS metrics in the RDS console
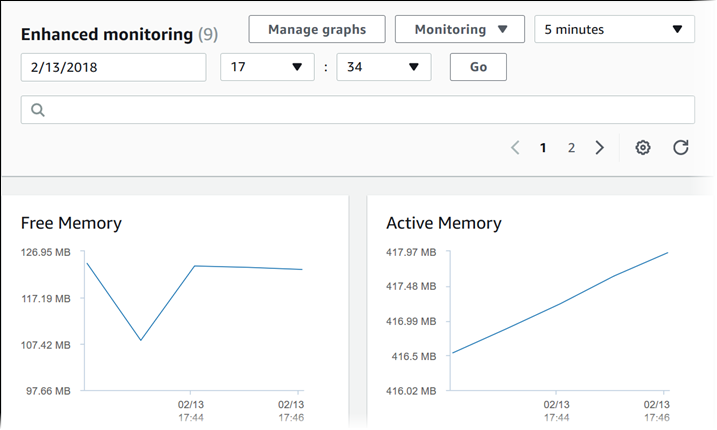
You can view OS metrics reported by Enhanced Monitoring in the RDS console by choosing Enhanced monitoring for Monitoring.
The following example shows the Enhanced Monitoring page. For descriptions of the Enhanced Monitoring metrics, see OS metrics in Enhanced Monitoring.
If you want to see details for the processes running on your DB instance, choose OS process list for Monitoring.
The Process List view is shown following.
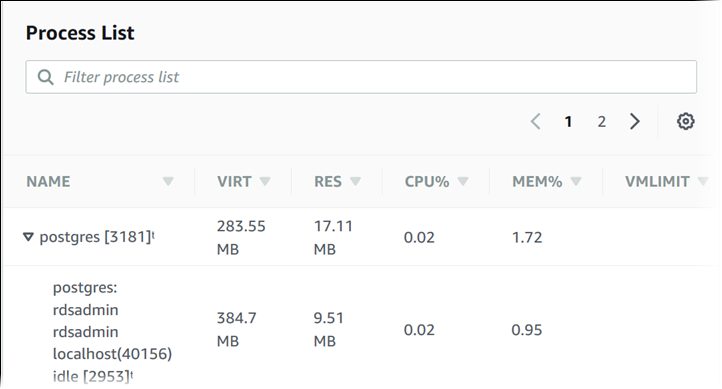
The Enhanced Monitoring metrics shown in the Process list view are organized as follows:
-
RDS child processes – Shows a summary of the RDS processes that support the DB instance, for example
aurorafor Amazon Aurora DB clusters. Process threads appear nested beneath the parent process. Process threads show CPU utilization only as other metrics are the same for all threads for the process. The console displays a maximum of 100 processes and threads. The results are a combination of the top CPU consuming and memory consuming processes and threads. If there are more than 50 processes and more than 50 threads, the console displays the top 50 consumers in each category. This display helps you identify which processes are having the greatest impact on performance. -
RDS processes – Shows a summary of the resources used by the RDS management agent, diagnostics monitoring processes, and other Amazon processes that are required to support RDS DB instances.
-
OS processes – Shows a summary of the kernel and system processes, which generally have minimal impact on performance.
The items listed for each process are:
-
VIRT – Displays the virtual size of the process.
-
RES – Displays the actual physical memory being used by the process.
-
CPU% – Displays the percentage of the total CPU bandwidth being used by the process.
-
MEM% – Displays the percentage of the total memory being used by the process.
The monitoring data that is shown in the RDS console is retrieved from Amazon CloudWatch Logs. You can also retrieve the metrics for a DB instance as a log stream from CloudWatch Logs. For more information, see Viewing OS metrics using CloudWatch Logs.
Enhanced Monitoring metrics are not returned during the following:
-
A failover of the DB instance.
-
Changing the instance class of the DB instance (scale compute).
Enhanced Monitoring metrics are returned during a reboot of a DB instance because only the database engine is rebooted. Metrics for the operating system are still reported.