Analyzing queries with the Top SQL tab in Performance Insights
In the Amazon RDS Performance Insights dashboard, you can find information about running and recent queries in the Top SQL tab in the Top dimensions table. You can use this information to tune your queries.
Topics
Overview of the Top SQL tab
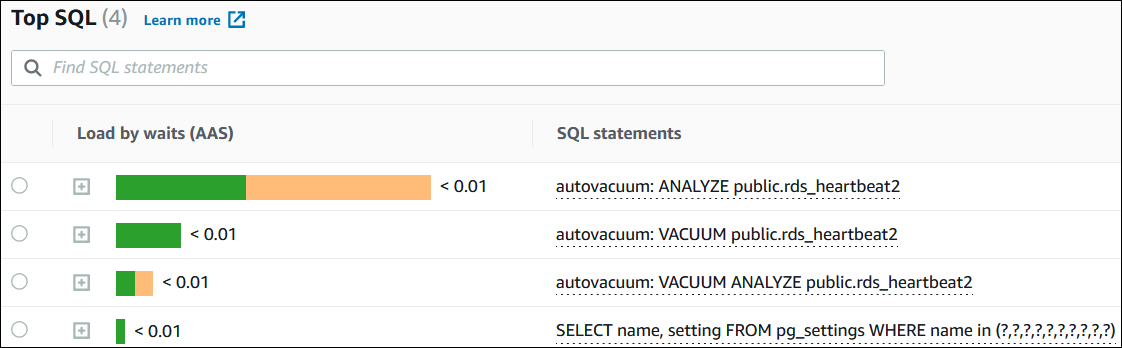
By default, the Top SQL tab shows the 25 queries that are contributing the most to DB load. To help tune your queries, you can analyze information such as the query text and SQL statistics. You can also choose the statistics that you want to appear in the Top SQL tab.
SQL text
By default, each row in the Top SQL table shows 500 bytes of text for each statement.
To learn how to see more than the default 500 bytes of SQL text, see Accessing more SQL text in the Performance Insights dashboard.
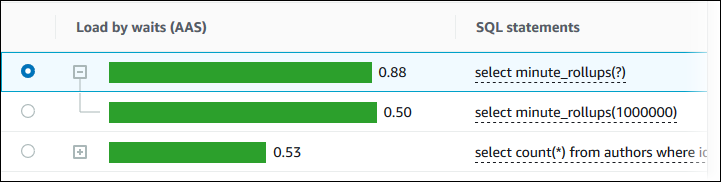
A SQL digest is a composite of multiple actual queries that are structurally similar but might have different
literal values. The digest replaces hardcoded values with a question mark. For example, a digest might be SELECT * FROM emp WHERE
lname= ?. This digest might include the following child queries:
SELECT * FROM emp WHERE lname = 'Sanchez'
SELECT * FROM emp WHERE lname = 'Olagappan'
SELECT * FROM emp WHERE lname = 'Wu'
To see the literal SQL statements in a digest, select the query, and then choose the plus symbol (+). In the following example, the selected query is a digest.
Note
A SQL digest groups similar SQL statements, but doesn't redact sensitive information.
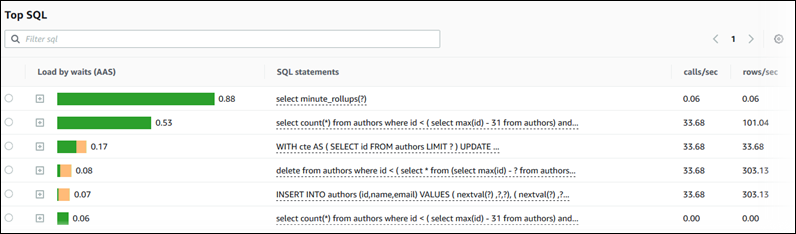
SQL statistics
SQL statistics are performance-related metrics about SQL queries. For example, Performance Insights might show executions per second or rows processed per second. Performance Insights collects statistics for only the most common queries. Typically, these match the top queries by load shown in the Performance Insights dashboard.
Every line in the Top SQL table shows relevant statistics for the SQL statement or digest, as shown in the following example.
Performance Insights can report 0.00 and - (unknown) for SQL statistics. This situation occurs under the
following conditions:
-
Only one sample exists. For example, Performance Insights calculates rates of change for Aurora PostgreSQL queries based on multiple samples from the
pg_stat_statementsview. When a workload runs for a short time, Performance Insights might collect only one sample, which means that it can't calculate a rate of change. The unknown value is represented with a dash (-). -
Two samples have the same values. Performance Insights can't calculate a rate of change because no change has occurred, so it reports the rate as
0.00. -
An Aurora PostgreSQL statement lacks a valid identifier. PostgreSQL creates a identifier for a statement only after parsing and analysis. Thus, a statement can exist in the PostgreSQL internal in-memory structures with no identifier. Because Performance Insights samples internal in-memory structures once per second, low-latency queries might appear for only a single sample. If the query identifier isn't available for this sample, Performance Insights can't associate this statement with its statistics. The unknown value is represented with a dash (
-).
For a description of the SQL statistics for the Aurora engines, see SQL statistics for Performance Insights.
Load by waits (AAS)
In Top SQL, the Load by waits (AAS) column illustrates the percentage of the database load associated with each top load item. This column reflects the load for that item by whatever grouping is currently selected in the DB Load Chart. For more information about Average active sessions (AAS), see Average active sessions.
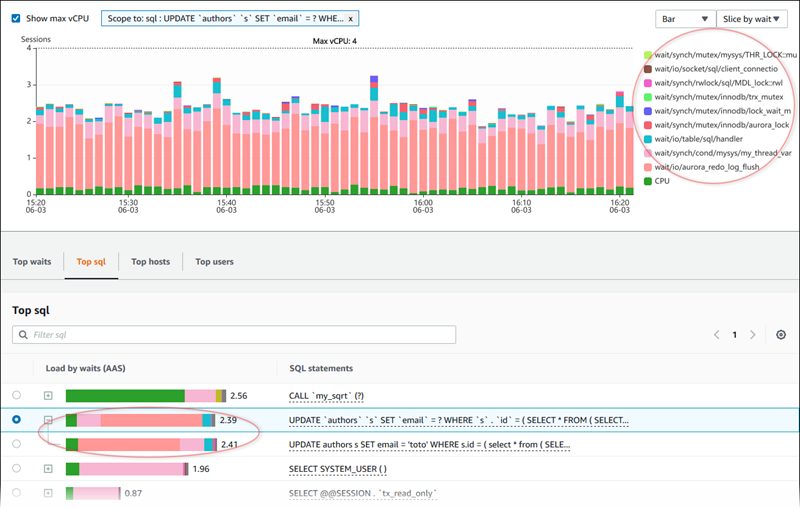
For example, you might group the DB load chart by wait states. You examine SQL queries in the top load items table. In this case, the DB Load by Waits bar is sized, segmented, and color-coded to show how much of a given wait state that query is contributing to. It also shows which wait states are affecting the selected query.
View SQL information
In the Top SQL table, you can open a statement to view its information. The information appears in the bottom pane.
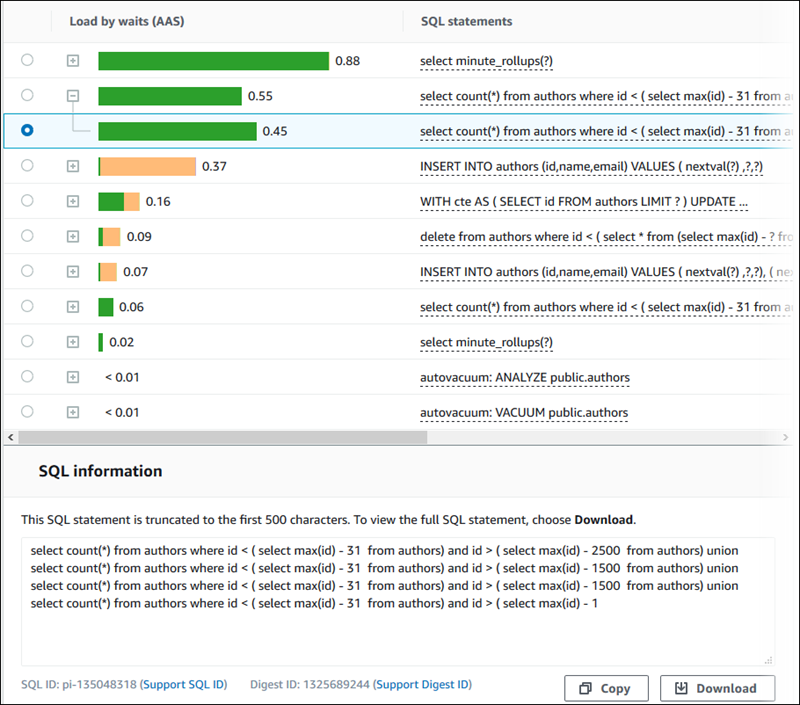
The following types of identifiers (IDs) that are associated with SQL statements:
-
Support SQL ID – A hash value of the SQL ID. This value is only for referencing a SQL ID when you are working with Amazon Support. Amazon Support doesn't have access to your actual SQL IDs and SQL text.
-
Support Digest ID – A hash value of the digest ID. This value is only for referencing a digest ID when you are working with Amazon Support. Amazon Support doesn't have access to your actual digest IDs and SQL text.
Choose statistics preferences
You can control the statistics displayed in the Top SQL tab by choosing the Preferences icon.
When you choose the Preferences icon, the Preferences window opens. The following screenshot is an example of the Preferences window.
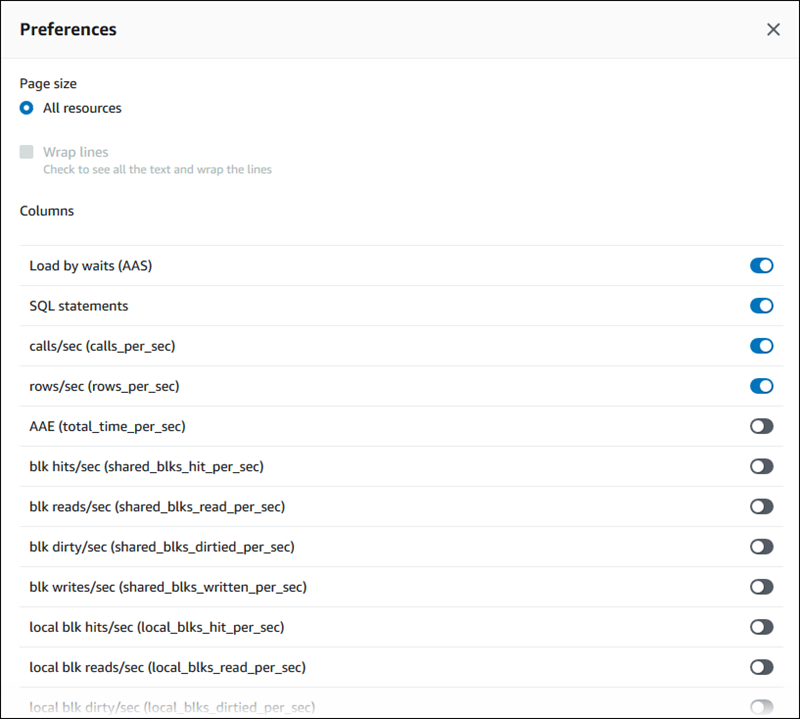
To enable the statistics that you want to appear in the Top SQL tab, use your mouse to scroll to the bottom of the window, and then choose Continue.
For more information about per-second or per-call statistics for the Aurora engines, see the engine specific SQL statistics section in SQL statistics for Performance Insights