Choosing the preconfigured dashboard with Performance Insights
Important
Amazon has announced the end-of-life date for Performance Insights: June 30, 2026. After this date, Amazon RDS will no longer support the Performance Insights console experience, flexible retention periods (1-24 months), and their associated pricing. The Performance Insights API will continue to exist with no pricing changes. Costs for the Performance Insights API will appear in your Amazon bill with the cost of CloudWatch Database Insights.
We recommend that you upgrade any DB clusters using the paid tier of Performance Insights to the Advanced mode of Database Insights before June 30, 2026. For information about upgrading to the Advanced mode of Database Insights, see Turning on the Advanced mode of Database Insights for Amazon Aurora.
If you take no action, DB clusters using Performance Insights will default to using the Standard mode of Database Insights. With Standard mode of Database Insights, you might lose access to performance data history beyond 7 days and might not be able to use execution plans and on-demand analysis features in the Amazon RDS console. After June 30, 2026 only the Advanced mode of Database Insights will support execution plans and on-demand analysis.
With CloudWatch Database Insights, you can monitor database load for your fleet of databases and analyze and troubleshoot performance at scale.
For more information about Database Insights, see Monitoring Amazon Aurora databases with CloudWatch Database Insights.
For pricing information, see Amazon CloudWatch Pricing
You can view the most commonly used metrics with the preconfigured dashboard. This dashboard helps diagnose performance issues with a database engine and reduce the average recovery time from hours to minutes.
Note
This dashboard can't be edited.
To choose the preconfigured dashboard with Performance Insights in the navigation pane
Sign in to the Amazon Web Services Management Console and open the Amazon RDS console at https://console.amazonaws.cn/rds/
. -
In the left navigation pane, choose Performance Insights.
-
Choose a DB instance.
-
Scroll down to the Metrics tab in the window
-
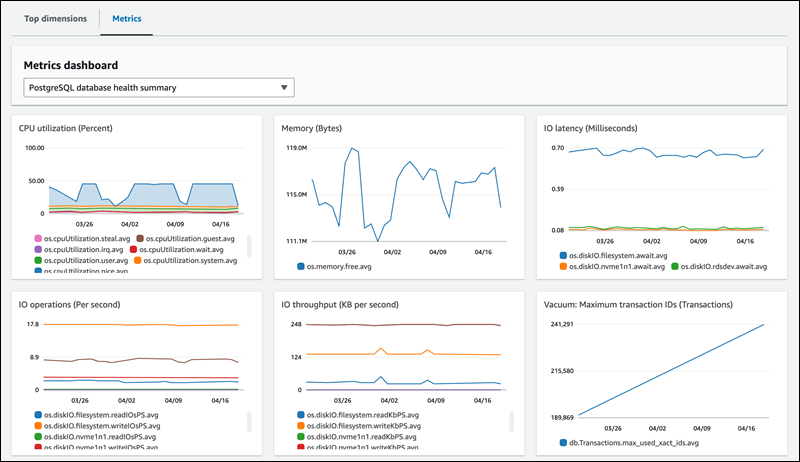
Select a preconfigured dashboard from the drop down list.
You can view the metrics for the DB instance in the dashboard. The following example shows a preconfigured metrics dashboard.
