Viewing and monitoring Aurora zero-ETL integrations
You can view the details of an Amazon Aurora zero-ETL integration to see its configuration information and current status. You can also monitor the status of your integration by querying specific system views in Amazon Redshift. In addition, Amazon Redshift publishes certain integration-related metrics to Amazon CloudWatch, which you can view within the Amazon Redshift console.
Topics
Viewing integrations
You can view Aurora zero-ETL integrations using the Amazon Web Services Management Console, the Amazon CLI, or the RDS API.
To view the details of a zero-ETL integration
Sign in to the Amazon Web Services Management Console and open the Amazon RDS console at https://console.amazonaws.cn/rds/
. -
From the left navigation pane, choose Zero-ETL integrations.
-
Select an integration to view more details about it, such as its source DB cluster and target data warehouse.
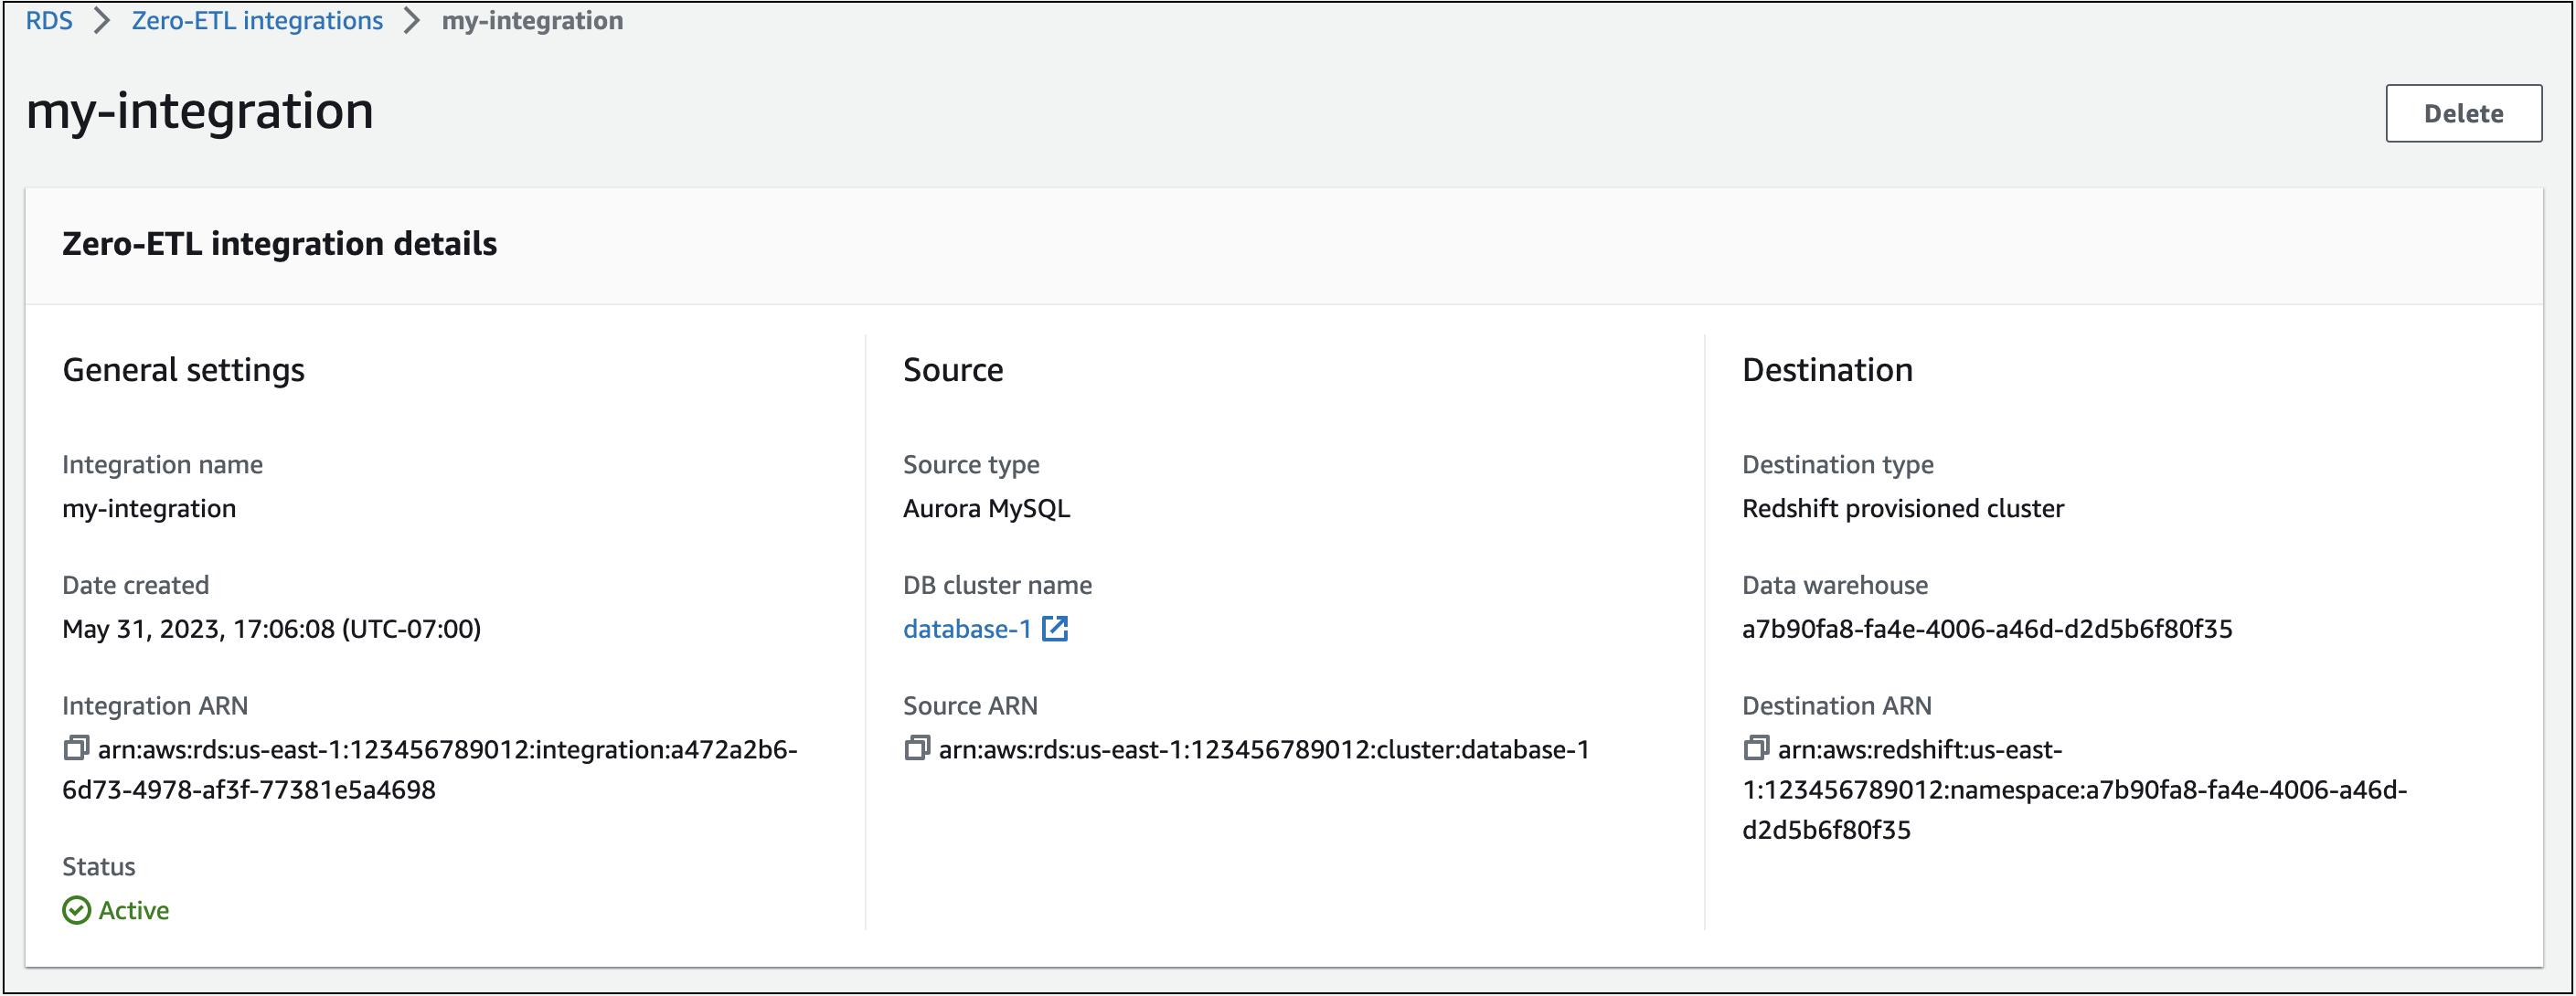
An integration can have the following statuses:
Creating– The integration is being created.Active– The integration is sending transactional data to the target data warehouse.-
Syncing– The integration has encountered a recoverable error and is reseeding data. Affected tables aren't available for querying until they finish resyncing. -
Needs attention– The integration encountered an event or error that requires manual intervention to resolve it. To fix the issue, follow the instructions in the error message on the integration details page. -
Failed– The integration encountered an unrecoverable event or error that can't be fixed. You must delete and recreate the integration. -
Deleting– The integration is being deleted.
To view all zero-ETL integrations in the current account using the Amazon CLI, use the
describe-integrations command and specify the
--integration-identifier option.
Example
For Linux, macOS, or Unix:
aws rds describe-integrations \ --integration-identifieree605691-6c47-48e8-8622-83f99b1af374
For Windows:
aws rds describe-integrations ^ --integration-identifieree605691-6c47-48e8-8622-83f99b1af374
To view zero-ETL integration using the Amazon RDS API, use the DescribeIntegrations operation with the
IntegrationIdentifier parameter.
Monitoring integrations using system tables for Amazon Redshift
Amazon Redshift has system tables and views that contain information about how the system is functioning. You can query these system tables and views the same way that you would query any other database table. For more information about system tables and views in Amazon Redshift, see System tables and views reference in the Amazon Redshift Database Developer Guide.
You can query the following system views and tables to get information about your Aurora zero-ETL integrations:
-
SVV_INTEGRATION – Provides configuration details for your integrations.
-
SVV_INTEGRATION_TABLE_STATE – Describes the state of each table within an integration.
-
SYS_INTEGRATION_TABLE_STATE_CHANGE – Displays table state change logs for an integration.
-
SYS_INTEGRATION_ACTIVITY – Provides information about completed integration runs.
All integration-related Amazon CloudWatch metrics originate from Amazon Redshift. For more information, see Metrics for zero-ETL integrations in the Amazon Redshift Management Guide. Currently, Amazon Aurora doesn't publish any integration metrics to CloudWatch.
Monitoring integrations with Amazon EventBridge for Amazon Redshift
Amazon Redshift send integration-related events to Amazon EventBridge. For a list of events and their corresponding event IDs, see Zero-ETL integration event notifications with Amazon EventBridge in the Amazon Redshift Management Guide.