Evaluate your costs at the table level
The Cost Explorer tool found within the Amazon Web Services Management Console allows you to see costs broken down by type, such as read, write, storage and backup charges. You can also see these costs summarized by period such as month or day.
One challenge administrators can face is when the costs of only one particular table need to
be reviewed. Some of this data is available via the DynamoDB console or via calls to the
DescribeTable API, however Cost Explorer does not, by default, allow you to
filter or group by costs associated with a specific table. This section will show you how to use
tagging to perform individual table cost analysis in Cost Explorer.
Topics
How to view the costs of a single DynamoDB table
Both the Amazon DynamoDB Amazon Web Services Management Console and the DescribeTable API will show you
information about a single table, including the primary key schema, any indexes on the table,
and the size and item count of the table and any indexes. The size of the table, plus the size
of the indexes, can be used to calculate the monthly storage cost for your table. For example,
$0.25 per GB in the us-east-1 region.
If the table is in provisioned capacity mode, the current RCU and WCU settings are returned as well. These could be used to calculate the current read and write costs for the table, but these costs could change, especially if the table has been configured with Auto Scaling.
Note
If the table is in on-demand capacity mode, then DescribeTable will not
help estimate throughput costs, as these are billed based on actual, not provisioned usage
in any one period.
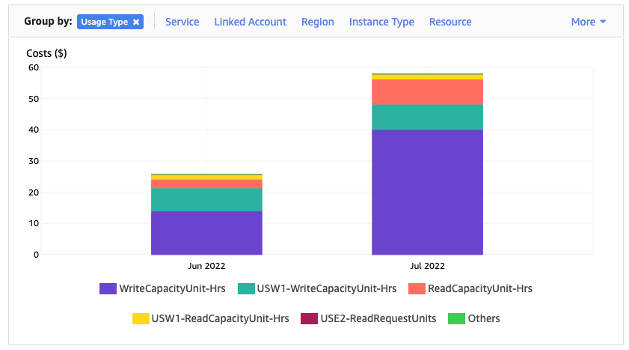
Cost Explorer's default view
Cost Explorer's default view provides charts showing the cost of consumed resources such as throughput and storage. You can choose to group costs by period, such as totals by month or by day. The costs of storage, reads, writes, and other features can be broken out and compared as well.
How to use and apply table tags in Cost Explorer
By default, Cost Explorer does not provide a summary of the costs for any one specific table, as it will combine the costs of multiple tables into a total. However, you can use Amazon resource tagging to identify each table by a metadata tag. Tags are key-value pairs you can use for a variety of purposes, such as to identify all resources belonging to a project or department. For this example, we'll assume you have a table named MyTable.
-
Set a tag with the key of table_name and the value of MyTable.
-
Activate the tag within Cost Explorer and then filter on the tag value to gain more visibility into each table's costs.
Note
It may take one or two days for the tag to start appearing in Cost Explorer
You can set metadata tags yourself in the console, or via automation such as the Amazon CLI
or Amazon SDK. Consider requiring a table_name tag to be set
as part of your organization’s new table creation process. For existing tables, there is a
Python utility available that will find and apply these tags to all existing tables in a
certain region in your account. See Eponymous
Table Tagger on GitHub