Identify your unused resources in DynamoDB
This section provides an overview of how to evaluate your unused resources regularly. As your application requirements evolve you should ensure no resources are unused and contributing to unnecessary Amazon DynamoDB costs. The procedures described below will use Amazon CloudWatch metrics to identify unused resources and will help you identify and take action on those resources to reduce costs.
You can monitor DynamoDB using CloudWatch, which collects and processes raw data from DynamoDB into readable, near real-time metrics. These statistics are retained for a period of time, so that you can access historical information to better understand your utilization. By default, DynamoDB metric data is sent to CloudWatch automatically. For more information, see What is Amazon CloudWatch? and Metrics retention in the Amazon CloudWatch User Guide.
Topics
How to identify unused resources
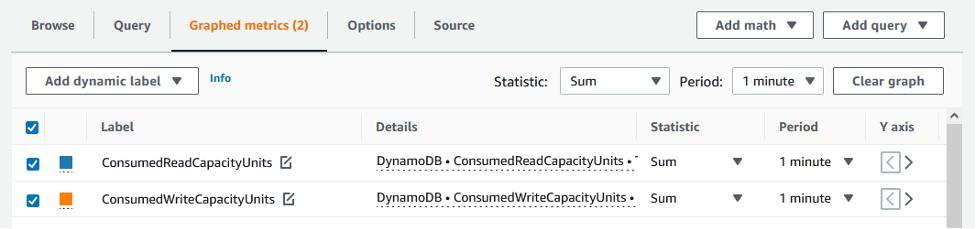
To identify unused tables or indexes, we'll look at the following CloudWatch metrics over a period of 30 days to understand if there are any active reads or writes on the table or any reads on the global secondary indexes (GSIs):
ConsumedReadCapacityUnits
The number of read capacity units consumed over the specified time period, so you can track how much consumed capacity you have used. You can retrieve the total consumed read capacity for a table and all of its global secondary indexes, or for a particular global secondary index.
ConsumedWriteCapacityUnits
The number of write capacity units consumed over the specified time period, so you can track how much consumed capacity you have used. You can retrieve the total consumed write capacity for a table and all of its global secondary indexes, or for a particular global secondary index.
Identifying unused table resources
Amazon CloudWatch is a monitoring and observability service which provides the DynamoDB table metrics you’ll use to identify unused resources. CloudWatch metrics can be viewed through the Amazon Web Services Management Console as well as through the Amazon Command Line Interface.

Cleaning up unused table resources
If you have identified unused table resources, you can reduce their ongoing costs in the following ways.
Note
If you have identified an unused table but would still like to keep it available in case it needs to be accessed in the future, consider switching it to on-demand mode. Otherwise, you can consider backing up and deleting the table entirely.
Capacity modes
DynamoDB charges for reading, writing, and storing data in your DynamoDB tables.
DynamoDB has two capacity modes, which come with specific billing options for processing reads and writes on your tables: on-demand and provisioned. The read/write capacity mode controls how you are charged for read and write throughput and how you manage capacity.
For on-demand mode tables, you don't need to specify how much read and write throughput you expect your application to perform. DynamoDB charges you for the reads and writes that your application performs on your tables in terms of read request units and write request units. If there is no activity on your table/index you do not pay for throughput but you’ll still incur a storage charge.
Table class
DynamoDB also offers two table classes designed to help you optimize for cost. The DynamoDB Standard table class is the default and is recommended for most workloads. The DynamoDB Standard-Infrequent Access (DynamoDB Standard-IA) table class is optimized for tables where storage is the dominant cost.
If there is no activity on your table or index, storage is likely to be the dominant cost and changing table class will offer a significant savings.
Deleting tables
If you’ve discovered an unused table and would like to delete it, you may wish to make a backup or export of the data first.
Backups taken through Amazon Backup can leverage cold storage tiering, further reducing costs. Refer to the Using Amazon Backup with DynamoDB documentation for information on how enable backups through Amazon Backup as well as the Managing backup plans documentation for information on how to use lifecycle to move your backup to cold storage.
Alternatively, you may choose to export your table’s data to S3. To do so, refer to the Export to Amazon S3 documentation. Once your data is exported, if you wish to leverage S3 Glacier Instant Retrieval, S3 Glacier Flexile Retrieval, or S3 Glacier Deep Archive to further reduce costs, see Managing your storage lifecycle.
After your table has been backed up, you may choose to delete it either through the Amazon Web Services Management Console or through the Amazon Command Line Interface.
Identifying unused GSI resources
The steps for identifying an unused global secondary are similar to those for identifying
an unused table. Since DynamoDB replicates items written to your base table into your GSI if they
contain the attribute used as the GSI’s partition key, an unused GSI is still likely to have
ConsumedWriteCapacityUnits above 0 if its base table is in use. As a result,
you’ll be evaluating only the ConsumedReadCapacityUnits metric to determine if
your GSI is unused.
To view your GSI metrics through the Amazon Amazon CLI, you can use the following commands to evaluate your tables reads:
aws cloudwatch get-metric-statistics --metric-name ConsumedReadCapacityUnits --start-time <start-time> --end-time <end- time> --period <period> --namespace AWS/DynamoDB --statistics Sum -- dimensions Name=TableName,Value=<table-name> Name=GlobalSecondaryIndexName,Value=<index-name>
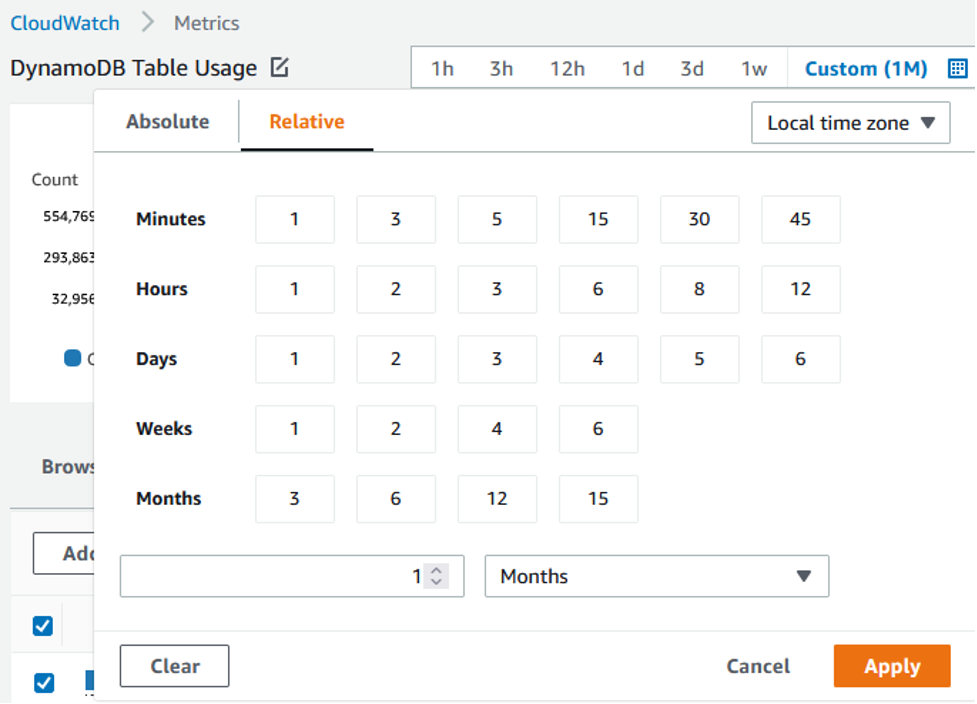
To avoid falsely identifying a table as unused, you will want to evaluate metrics over a longer period. Choose an appropriate start-time and end-time range, such as 30 days, and an appropriate period, such as 86400.
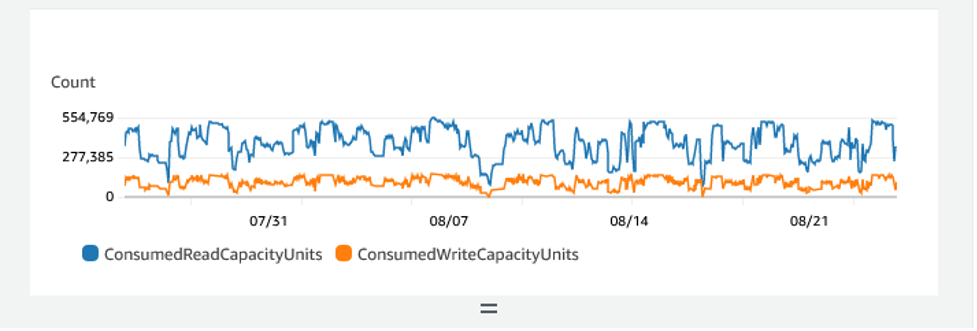
In the returned data, any Sum above 0 indicates that the table you are evaluating received read traffic during that period.
The following result shows a GSI receiving read traffic in the evaluated period:
        {
          "Timestamp": "2022-08-17T21:20:00Z",
          "Sum": 36319167.0,
          "Unit": "Count"
        },
        {
          "Timestamp": "2022-08-11T21:20:00Z",
          "Sum": 1869136.0,
          "Unit": "Count"
        },
The following result shows a GSI receiving minimal read traffic in the evaluated period:
        {
          "Timestamp": "2022-08-28T21:20:00Z",
          "Sum": 0.0,
          "Unit": "Count"
        },
        {
          "Timestamp": "2022-08-15T21:20:00Z",
          "Sum": 2.0,
          "Unit": "Count"
        },
The following result shows a GSI receiving no read traffic in the evaluated period:
        {
          "Timestamp": "2022-08-17T21:20:00Z",
          "Sum": 0.0,
          "Unit": "Count"
        },
        {
          "Timestamp": "2022-08-11T21:20:00Z",
          "Sum": 0.0,
          "Unit": "Count"
        },
Cleaning up unused GSI resources
If you've identified an unused GSI, you can choose to delete it. Since all data present in a GSI is also present in the base table, additional backup is not necessary before deleting a GSI. If in the future the GSI is once again needed, it may be added back to the table.
If you have identified an infrequently used GSI, you should consider design changes in your application that would allow you to delete it or reduce its cost. For example, while DynamoDB scans should be used sparingly because they can consume large amounts of system resources, they may be more cost effective than a GSI if the access pattern it supports is used very infrequently.
Additionally, if a GSI is required to support an infrequent access pattern consider projecting a more limited set of attributes. While this may require subsequent queries against the base table to support your infrequent access patterns, it can potentially offer a significant reduction in storage and write costs.
Cleaning up unused global tables
Amazon DynamoDB global tables provide a fully managed solution for deploying a multi-Region, multi-active database, without having to build and maintain your own replication solution.
Global tables are ideal for providing low-latency access to data close to users and as well as a secondary region for disaster recovery.
If the global tables option is enabled for a resource in an effort to provide low-latency access to data but is not part of your disaster recovery strategy, validate that both replicas are actively serving read traffic by evaluating their CloudWatch metrics. If one replica does not serve read traffic, it may be an unused resource.
If global tables are part of your disaster recovery strategy, one replica not receiving read traffic may be expected under an active/standby pattern.
Cleaning up unused backups or point-in-time recovery (PITR)
DynamoDB offers two styles of backup. Point-in-time recovery provides continuous backups for up to 35 days to help you protect against accidental writes or deletes while on-demand backup allows for snapshot creation which can be saved long term. You can set the recovery period to any value between 1 and 35 days. Both types of backups have costs associated with them.
Refer to the documentation for Backup and restore for DynamoDB and Point-in-time backups for DynamoDB to determine if your tables have backups enabled that may no longer be needed.