Troubleshooting throttling in Amazon DynamoDB
DynamoDB implements throttling for two primary purposes: maintaining overall service performance and cost control. Throttling either serves as an intentional safeguard that prevents performance degradation when consumption rates exceed capacity or as a cost control mechanism when you reach maximum throughput or service quota limits. When throttling occurs, DynamoDB returns specific exceptions with detailed information about why the request was throttled and which resource was impacted. Each reason for throttling corresponds to specific CloudWatch metrics that provide additional insights into the frequency and patterns of throttling events.
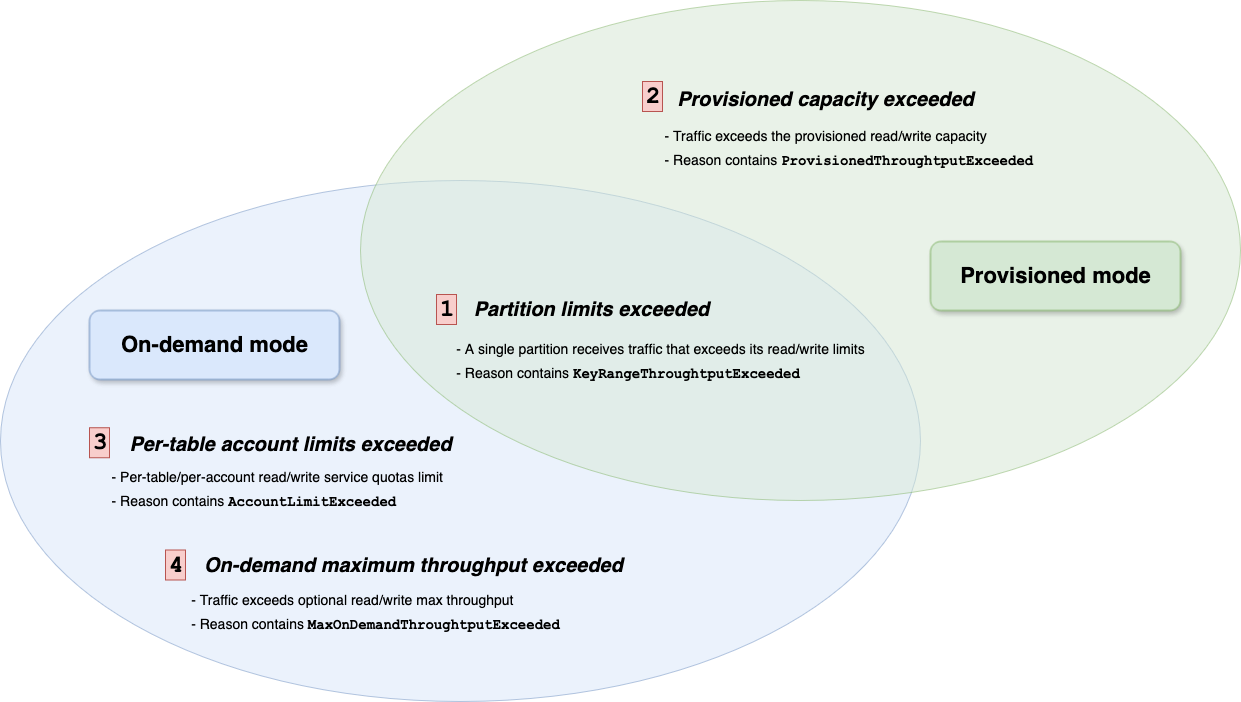
The following diagram illustrates the four primary scenarios where DynamoDB implements protective throttling:
-
Key range throughput exceeded (in both modes):
Consumption directed at specific partitions exceeds the internal partition-level throughput limits.
-
Provisioned throughput exceeded (in provisioned mode):
Consumption exceeds the provisioned capacity units (read or write) configured for a table or a global secondary index (GSI).
-
Account-level service quotas exceeded (in on-demand mode):
Consumption causes a table or GSI to exceed the per-table account-level service quotas for read/write throughput in the current Amazon Region. These quotas serve as backstop safeguards and can be increased.
-
On-demand maximum throughput exceeded (in on-demand mode):
Consumption exceeds the configured maximum throughput limits set for a table or GSI. These are limits you configure specifically for cost control purposes.
This guide is organized to help you understand and work with throttling in DynamoDB. First, we help you identify the specific type of throttling affecting your workload through a diagnostic framework.
Then, the resolution guide section offers specific guidance for each throttling scenario, including CloudWatch metrics to monitor for detection and analysis, and recommended steps for optimization. By following this structured approach, you can better diagnose the root cause of throttling and implement the appropriate solution to ensure your DynamoDB tables operate efficiently.
To get started, follow Diagnosing throttling to learn how to identify which type of throttling is affecting your workload and implement the recommended resolution strategy.