Viewing Insights events for trails with the console
This section describes how to view, look up, and download the last 90 days of Insights events for a trail from the Insights page on the CloudTrail console. For information about how to view CloudTrail Insights for an event data store, see Viewing the Insights dashboard for an event data store.
After Insights events are logged for a trail, the events are shown on the Insights page for 90 days. You cannot manually delete events from the Insights page. Since Insights events enabled for a trail are stored in the Amazon S3 bucket configured for that trail, removing the Insights events from the bucket will delete those events.
You can monitor your trail logs and be notified when specific Insights events occur by enabling CloudWatch Logs. For more information, see Monitoring CloudTrail Log Files with Amazon CloudWatch Logs.
Note
-
CloudTrail Insights events must be enabled on your trail to see Insights events in the console. Allow up to 36 hours for CloudTrail to deliver the first Insights events, provided that unusual activity is detected during that time.
-
For Management events Insights: To log Insights events on the API call rate, the trail must log
writemanagement events. To log Insights events on the API error rate, the trail must logreadorwritemanagement events. -
For Data events Insights: To log Insights events on the API call rate or API error rate, the trail must log
readorwritedata events.
To view Insights events
-
Sign in to the Amazon Web Services Management Console and open the CloudTrail console at https://console.amazonaws.cn/cloudtrail/home/
. -
In the navigation pane, choose Insights to see all Insights events logged in your account in the last 90 days. You can also view the five most recent Insights events from the Dashboards page.
-
On the Insights page, you can select either the management events Insights or data events Insights tab
-
You can filter Insights events by event source, event name, or event ID. For more information about filtering Insights events, see Filtering Insights events.
-
You can further limit the list to a Relative range or Absolute range.
Contents
Filtering Insights events
By default, events on the Insights page are shown in reverse chronological order by event start time.
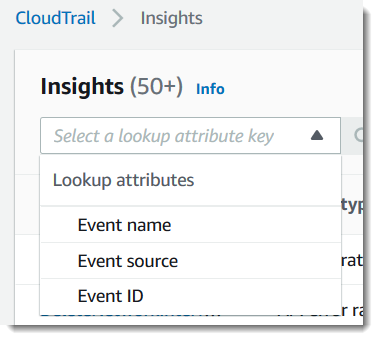
You can filter the list by choosing from one of the following three attributes:
- Event name
-
The name of the event, typically the Amazon API on which unusual levels of activity were recorded.
- Event source
-
The Amazon service to which the request was made, such as
iam.amazonaws.comors3.amazonaws.com. If you choose to filter by event source, you can scroll through a list of event sources. - Event ID
-
The ID of the Insights event. Event IDs are not shown in the Insights page table, but they are an attribute on which you can filter Insights events. The event IDs of management or data events that are analyzed to generate Insights events are different from the event IDs of Insights events.
The following list describes the attributes of an event, which are not filterable:
- Insight type
-
The type of CloudTrail Insights event, which is either API call rate or API error rate. The API call rate insight type analyzes write-only management or data API calls that are aggregated per minute against a baseline API call volume. The API error rate insight type analyzes management or data API calls that result in error codes. The error is shown if the API call is unsuccessful.
- Event start time
-
The start time of the Insights event, measured as the first minute in which unusual activity was recorded. This attribute is shown in the Insights table, but you cannot filter on event start time in the console.
- Baseline average
-
Baseline represents the normal pattern of API call rate or error rate activity, calculated daily. The baseline average is the average of these daily baselines over the seven days preceding the start of an Insights event. While this period is generally seven days, CloudTrail rounds the calculation period to a whole number of days, so the exact baseline duration may vary slightly.
- Insight average
-
The average number of calls to an API, or the average number of a specific error that was returned on calls to an API, that triggered the Insights event. The CloudTrail Insights average for the start event is the rate of occurrences that triggered the Insights event. Typically, this is the first minute of unusual activity. The Insights average for the end event is the rate of occurrences over the duration of the unusual activity, between the start Insights event and the end Insights event.
- Rate change
-
The difference between the value of Baseline average and Insight average, measured as a percentage. For example, if the baseline average of an
AccessDeniederror occurring is 1.0, and the Insight average is 3.0, the rate change is 300%. A rate change for an Insight average that exceeds a baseline average shows an up-arrow next to the value. If the Insights event was logged because the activity is below the baseline average, Rate change shows a down-arrow next to the percentage.
If there are no events logged for the attribute or time that you choose, the results list is empty. You can apply only one attribute filter in addition to the time range. If you choose a different attribute filter, your specified time range is preserved.
The following steps describe how to filter by attribute.
To filter by attribute
-
To filter the results by an attribute, choose a lookup attribute from the dropdown menu, and then type or choose a value in the Enter a lookup value box.
-
To remove an attribute filter, choose the X on the right of the attribute filter box.
The following steps describe how to filter by a start and end date and time.
To filter by a start and end date and time
-
From Filter by date and time, choose one of the following:
-
Absolute range - Lets you choose a specific time. Go on to the next step.
-
Relative range - Selected by default. Lets you choose a time period relative to the start time of an Insights event. Go on to step 3.
-
-
To set an Absolute range, do the following.
-
Choose the day that you want the time range to start. Enter a start time on the selected day. To enter a date manually, type the date in the format
yyyy/mm/dd. The start and end times use a 24-hour clock, and values must be in the formathh:mm:ss. For example, to indicate a 6:30 p.m. start time, enter18:30:00. -
Choose an end date for the range on the calendar, or specify an end date and time below the calendar. Choose Apply.
-
-
To set a Relative range, do the following.
-
Choose a preset time period relative to the start time of Insights events. Preset time ranges include 30 minutes, 1 hour, 12 hours, or 1 day. To specify a custom time range, choose Custom.
-
When you have set the relative time that you want, choose Apply.
-
-
To remove a time range filter, choose the calendar icon on the right of the Filter by date and time box, and then choose Clear and dismiss.
Viewing Insights events details
-
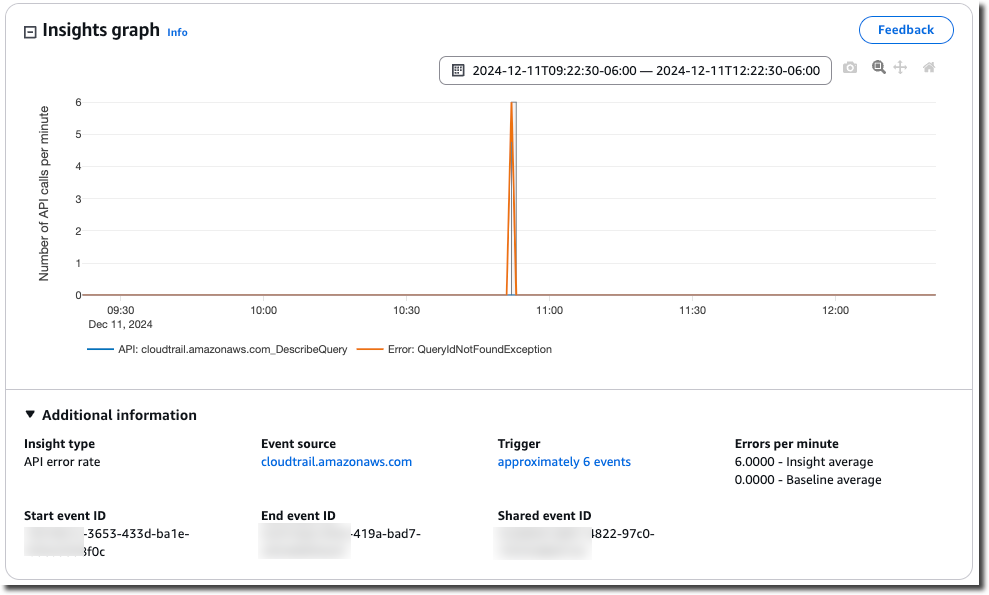
Choose an Insights event in the results list to show its details. The details page for an Insights event shows a graph of the unusual activity timeline.
-
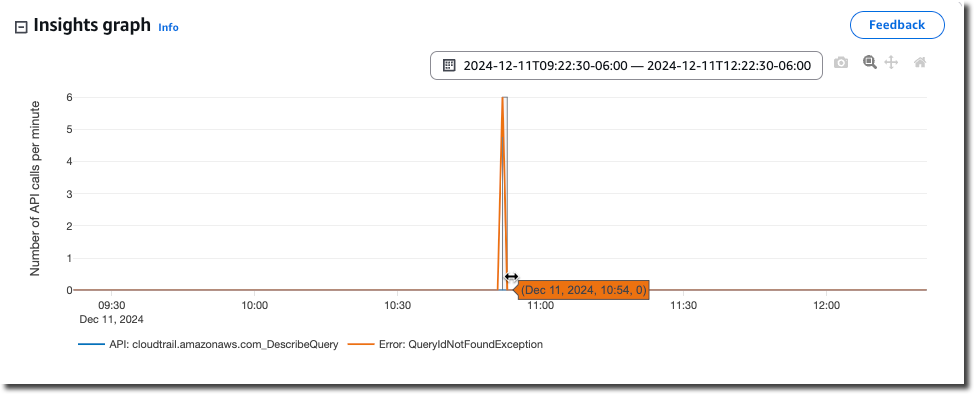
Hover over the highlighted bands to show the start time and duration of each Insights event in the graph.
The following information is shown in the Additional information area of the graph:
-
Insight type. This can be API call rate or API error rate.
-
Trigger. This is a link to the Cloudtrail events tab, which lists the management or data events that were analyzed to determine that unusual activity occurred.
-
API calls per minute or Errors per minute
-
Baseline average - The typical rate of occurrences per minute on the API on which the Insights event was logged, as measured within approximately the preceding seven days, in a specific Region in your account.
-
Insights average - The rate of occurrences per minute on this API that triggered the Insights event. The CloudTrail Insights average for the start event is the rate of calls or errors per minute on the API that triggered the Insights event. Typically, this is the first minute of unusual activity. The Insights average for the end event is the rate of API calls or errors per minute over the duration of the unusual activity, between the start Insights event and the end Insights event.
-
-
Event source. The Amazon service endpoint on which the unusual number of API calls or errors were logged. In the preceding image, the source is
ec2.amazonaws.com, which is the service endpoint for Amazon EC2. -
Start event ID - The ID of the Insights event that was logged at the start of unusual activity.
-
End event ID - The ID of the Insights event that was logged at the end of unusual activity.
-
Shared event ID - In Insights events, the Shared event ID is a GUID that is generated by CloudTrail Insights to uniquely identify a start and end pair of Insights events. Shared event ID is common between the start and the end Insights event, and helps to create a correlation between both events to uniquely identify unusual activity.
-
-
Choose the Attributions tab to view information about the user identities, user agents, and on API call rate Insights events, error codes correlated with unusual and baseline activity. A maximum of five user identities, five user agents, and five error codes are shown in tables on the Attributions tab, sorted by an average of the count of activity, in descending order from highest to lowest.
-
On the CloudTrail events tab, view related events that CloudTrail analyzed to determine that unusual activity occurred. By default, a filter is already applied for the Insights event name, which is also the name of the related API. The CloudTrail events tab shows CloudTrail management or data events related to the subject API that occurred between the start time (minus one minute) and end time (plus one minute) of the Insights event.
As you select other Insights events in the graph, the events shown in the CloudTrail events table change. These events help you perform deeper analysis to determine the probable cause of an Insights event and reasons for unusual API activity.
To show all CloudTrail events that were logged during the Insights event duration, and not only those for the related API, turn off the filter.
-
Choose the Insights event record tab to view the Insights start and end events in JSON format.
-
Choosing the linked Event source returns you to the Insights page, filtered by that event source.
Zoom, pan, and download graph
You can zoom, pan, and reset the axes of the graph on the Insights event details page by using a toolbar in the upper right corner.

From left to right, the command buttons on the graph toolbar do the following:
-
Download plot as a PNG - Download the graph image shown on the details page, and save it in PNG format.
-
Zoom - Drag to select an area on the graph that you want to enlarge and see in greater detail.
-
Pan - Shift the graph to see adjacent dates or times.
-
Reset axes - Change graph axes back to the original, clearing zoom and pan settings.
Change graph time span settings
You can change the time span—the selected duration of the events shown on the x axis—that is shown in the graph by choosing a setting in the graph's upper right corner.
Downloading Insights events
You can download recorded Insights event history as a file in CSV or JSON format. Use filters and time ranges to reduce the size of the file you download.
Note
CloudTrail event history files are data files that contain information (such as resource names) that can be configured by individual users. Some data can potentially be interpreted as commands in programs used to read and analyze this data (CSV injection). For example, when CloudTrail events are exported to CSV and imported to a spreadsheet program, that program might warn you about security concerns. As a security best practice, disable links or macros from downloaded event history files.
-
Specify the filter and time range for events you want to download. For example, you can specify the event name,
StartInstances, and specify a time range for the last 12 hours of activity. -
Choose Download events, and then choose Download as CSV or Download as JSON. You are prompted to choose a location to save the file.
Note
Your download might take some time to finish. For faster results, before you start the download process, use a more specific filter or a shorter time range to narrow the results.
-
After your download is complete, open the file to view the events that you specified.
-
To cancel your download, choose Cancel. If you cancel a download before it is finished, a CSV or JSON file on your local computer might contain only part of your events.