Creating Amazon CloudWatch alarms to monitor Amazon Trusted Advisor metrics
When Amazon Trusted Advisor refreshes your checks, Trusted Advisor publishes metrics about your check results to CloudWatch. You can view the metrics in CloudWatch. You can also create alarms to detect status changes to Trusted Advisor checks and status changes for resources, and service quota usage (formerly referred to as limits).
Follow this procedure to create a CloudWatch alarm for a specific Trusted Advisor metric.
Prerequisites
Before you create CloudWatch alarms for Trusted Advisor metrics, review the following information:
-
Understand how CloudWatch uses metrics and alarms. For more information, see How CloudWatch works in the Amazon CloudWatch User Guide.
-
Use the Trusted Advisor console or the Amazon Web Services Support API to refresh your checks and get the latest check results. For more information, see Refresh check results.
To create a CloudWatch alarm for Trusted Advisor metrics
Open the CloudWatch console at https://console.amazonaws.cn/cloudwatch/
. -
Use the Region selector and choose the US East (N. Virginia) Amazon Region.
-
In the navigation pane, choose Alarms.
-
Choose Create alarm.
-
Choose Select metric.
-
For Metrics, enter one or more dimension values to filter the metric list. For example, you can enter the metric name ServiceLimitUsage or the dimension, such as the Trusted Advisor check name.
Tip
-
You can search for
Trusted Advisorto list all metrics for the service. -
For a list of metric and dimension names, see Trusted Advisor metrics and dimensions.
-
-
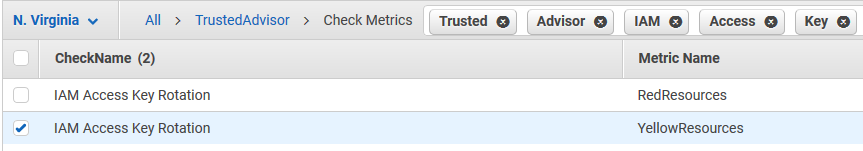
In the results table, select the check box for the metric.
In the following example, the check name is IAM Access Key Rotation and the metric name is YellowResources.
-
Choose Select metric.
-
On the Specify metric and conditions page, verify that the Metric name and CheckName that you chose appear on the page.
-
For Period, you can specify the time period that you want the alarm to start when the check status changes, such as 5 minutes.
-
Under Conditions, choose Static, and then specify the alarm condition for when the alarm should start.
For example, if you choose Greater/Equal >=threshold and enter
1for the threshold value, this means that the alarm starts when Trusted Advisor detects at least one IAM access key that hasn't been rotated in the last 90 days.Notes
-
For the GreenChecks, RedChecks, YellowChecks, RedResources, and YellowResources metrics, you can specify a threshold that is any whole number greater than or equal to zero.
-
Trusted Advisor doesn’t send metrics for GreenResources, which are resources for which Trusted Advisor hasn’t detected any issues.
-
-
Choose Next.
-
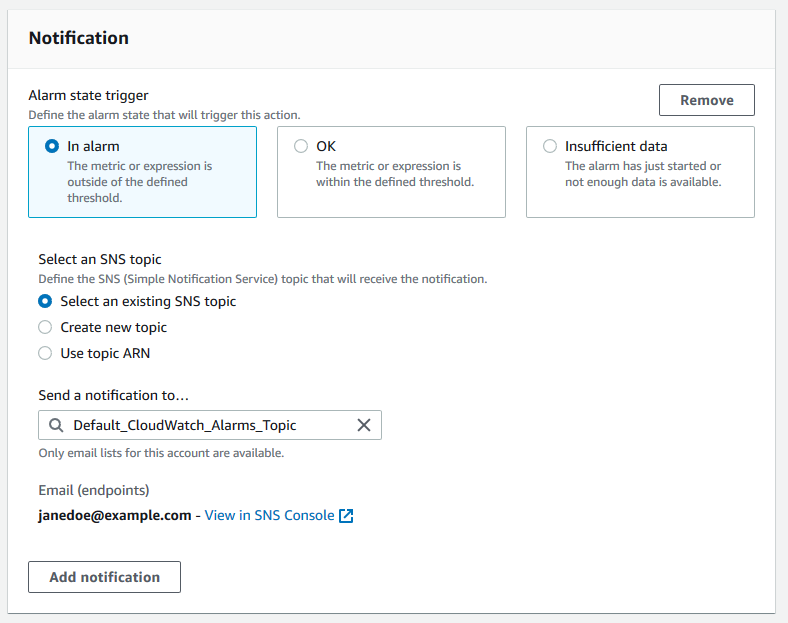
On the Configure actions page, for Alarm state trigger, choose In alarm.
-
For Select an SNS topic, choose an existing Amazon Simple Notification Service (Amazon SNS) topic or create one.
-
Choose Next.
-
For Name and description, enter a name and description for your alarm.
-
Choose Next.
-
On the Preview and create page, review your alarm details, and then choose Create alarm.
When the status for the IAM Access Key Rotation check changes to red for 5 minutes, your alarm will send a notification to your SNS topic.
Example: Email notification for a CloudWatch alarm
The following email message shows that an alarm detected a change for the IAM Access Key Rotation check.
You are receiving this email because your Amazon CloudWatch Alarm "IAMAcessKeyRotationCheckAlarm" in the US East (N. Virginia) region has entered the ALARM state,
because "Threshold Crossed: 1 out of the last 1 datapoints [9.0 (26/03/21 22:44:00)] was greater than or equal to the threshold (1.0) (minimum 1 datapoint for OK -> ALARM transition)." at "Friday 26 March, 2021 22:49:42 UTC".

View this alarm in the Amazon Web Services Management Console:
https://us-east-1.console.aws.amazon.com/cloudwatch/home?region=us-east-1#s=Alarms&alarm=IAMAcessKeyRotationCheckAlarm

Alarm Details:
- Name:                       IAMAcessKeyRotationCheckAlarm
- Description:                This alarm starts when one or more Amazon access keys in my Amazon account have not been rotated in the last 90 days.
- State Change:               INSUFFICIENT_DATA -> ALARM
- Reason for State Change:    Threshold Crossed: 1 out of the last 1 datapoints [9.0 (26/03/21 22:44:00)] was greater than or equal to the threshold (1.0) (minimum 1 datapoint for OK -> ALARM transition).
- Timestamp:                  Friday 26 March, 2021 22:49:42 UTC
- Amazon Account:                123456789012
- Alarm Arn:                  arn:aws:cloudwatch:us-east-1:123456789012:alarm:IAMAcessKeyRotationCheckAlarm

Threshold:
- The alarm is in the ALARM state when the metric is GreaterThanOrEqualToThreshold 1.0 for 300 seconds.

Monitored Metric:
- MetricNamespace:                     AWS/TrustedAdvisor
- MetricName:                          RedResources
- Dimensions:                          [CheckName = IAM Access Key Rotation]
- Period:                              300 seconds
- Statistic:                           Average
- Unit:                                not specified
- TreatMissingData:                    missing


State Change Actions:
- OK:
- ALARM: [arn:aws:sns:us-east-1:123456789012:Default_CloudWatch_Alarms_Topic]
- INSUFFICIENT_DATA:
CloudWatch metrics for Trusted Advisor
You can use the CloudWatch console or the Amazon Command Line Interface (Amazon CLI) to find the metrics available for Trusted Advisor.
For a list of the namespaces, metrics, and dimensions for all services that publish metrics, see Amazon services that publish CloudWatch metrics in the Amazon CloudWatch User Guide.
View Trusted Advisor metrics (console)
You can sign in to the CloudWatch console and view the available metrics for Trusted Advisor.
To view available Trusted Advisor metrics (console)
Open the CloudWatch console at https://console.amazonaws.cn/cloudwatch/
. -
Use the Region selector and choose the US East (N. Virginia) Amazon Region.
-
In the navigation pane, choose Metrics.
-
Enter a metric namespace, such as
TrustedAdvisor. -
Choose a metric dimension, such as Check Metrics.
-
The All metrics tab shows metrics for that dimension in the namespace. You can do the following:
-
To sort the table, choose the column heading.
-
To graph a metric, select the check box next to the metric. To select all metrics, select the check box in the heading row of the table.
-
To filter by metric, choose the metric name, and then choose Add to search.
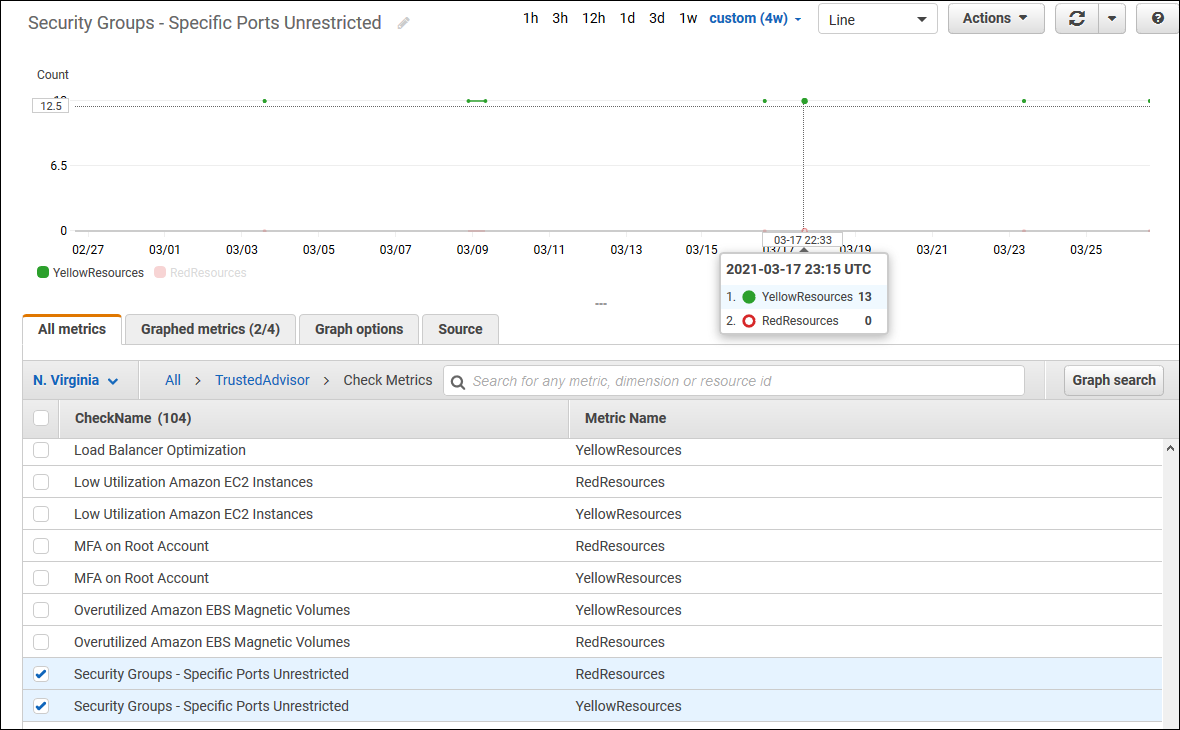
The following example shows the results for the Security Groups - Specific Ports Unrestricted check. The check identifies 13 resources that are yellow. Trusted Advisor recommends that you investigate checks that are yellow.
-
-
(Optional) To add this graph to a CloudWatch dashboard, choose Actions, and then choose Add to dashboard.
For more information about creating a graph to view your metrics, see Graphing a metric in the Amazon CloudWatch User Guide.
View Trusted Advisor metrics (CLI)
You can use the list-metrics Amazon CLI command to view available metrics for Trusted Advisor.
Example: List all metrics for Trusted Advisor
The following example specifies the AWS/TrustedAdvisor namespace to view
all metrics for Trusted Advisor.
aws cloudwatch list-metrics --namespace AWS/TrustedAdvisor
Your output might look like the following.
{
    "Metrics": [
        {
            "Namespace": "AWS/TrustedAdvisor",
            "Dimensions": [
                {
                    "Name": "ServiceName",
                    "Value": "EBS"
                },
                {
                    "Name": "ServiceLimit",
                    "Value": "Magnetic (standard) volume storage (TiB)"
                },
                {
                    "Name": "Region",
                    "Value": "ap-northeast-2"
                }
            ],
            "MetricName": "ServiceLimitUsage"
        },
        {
            "Namespace": "AWS/TrustedAdvisor",
            "Dimensions": [
                {
                    "Name": "CheckName",
                    "Value": "Overutilized Amazon EBS Magnetic Volumes"
                }
            ],
            "MetricName": "YellowResources"
        },
        {
            "Namespace": "AWS/TrustedAdvisor",
            "Dimensions": [
                {
                    "Name": "ServiceName",
                    "Value": "EBS"
                },
                {
                    "Name": "ServiceLimit",
                    "Value": "Provisioned IOPS"
                },
                {
                    "Name": "Region",
                    "Value": "eu-west-1"
                }
            ],
            "MetricName": "ServiceLimitUsage"
        },
        {
            "Namespace": "AWS/TrustedAdvisor",
            "Dimensions": [
                {
                    "Name": "ServiceName",
                    "Value": "EBS"
                },
                {
                    "Name": "ServiceLimit",
                    "Value": "Provisioned IOPS"
                },
                {
                    "Name": "Region",
                    "Value": "ap-south-1"
                }
            ],
            "MetricName": "ServiceLimitUsage"
        },
    ...
  ]
}
Example: List all metrics for a dimension
The following example specifies the AWS/TrustedAdvisor namespace and the
Region dimension to view the metrics available for the specified Amazon
Region.
aws cloudwatch list-metrics --namespace AWS/TrustedAdvisor --dimensions Name=Region,Value=us-east-1
Your output might look like the following.
{
    "Metrics": [
        {
            "Namespace": "AWS/TrustedAdvisor",
            "Dimensions": [
                {
                    "Name": "ServiceName",
                    "Value": "SES"
                },
                {
                    "Name": "ServiceLimit",
                    "Value": "Daily sending quota"
                },
                {
                    "Name": "Region",
                    "Value": "us-east-1"
                }
            ],
            "MetricName": "ServiceLimitUsage"
        },
        {
            "Namespace": "AWS/TrustedAdvisor",
            "Dimensions": [
                {
                    "Name": "ServiceName",
                    "Value": "AutoScaling"
                },
                {
                    "Name": "ServiceLimit",
                    "Value": "Launch configurations"
                },
                {
                    "Name": "Region",
                    "Value": "us-east-1"
                }
            ],
            "MetricName": "ServiceLimitUsage"
        },
        {
            "Namespace": "AWS/TrustedAdvisor",
            "Dimensions": [
                {
                    "Name": "ServiceName",
                    "Value": "CloudFormation"
                },
                {
                    "Name": "ServiceLimit",
                    "Value": "Stacks"
                },
                {
                    "Name": "Region",
                    "Value": "us-east-1"
                }
            ],
            "MetricName": "ServiceLimitUsage"
        },
    ...
  ]
}
Example: List metrics for a specific metric name
The following example specifies the AWS/TrustedAdvisor namespace and the
RedResources metric name to view the results for only this specific
metric.
aws cloudwatch list-metrics --namespace AWS/TrustedAdvisor --metric-nameRedResources
Your output might look like the following.
{
    "Metrics": [
        {
            "Namespace": "AWS/TrustedAdvisor",
            "Dimensions": [
                {
                    "Name": "CheckName",
                    "Value": "Amazon RDS Security Group Access Risk"
                }
            ],
            "MetricName": "RedResources"
        },
        {
            "Namespace": "AWS/TrustedAdvisor",
            "Dimensions": [
                {
                    "Name": "CheckName",
                    "Value": "Exposed Access Keys"
                }
            ],
            "MetricName": "RedResources"
        },
        {
            "Namespace": "AWS/TrustedAdvisor",
            "Dimensions": [
                {
                    "Name": "CheckName",
                    "Value": "Large Number of Rules in an EC2 Security Group"
                }
            ],
            "MetricName": "RedResources"
        },
        {
            "Namespace": "AWS/TrustedAdvisor",
            "Dimensions": [
                {
                    "Name": "CheckName",
                    "Value": "Auto Scaling Group Health Check"
                }
            ],
            "MetricName": "RedResources"
        },
    ...
  ]
}
Trusted Advisor metrics and dimensions
See the following tables for the Trusted Advisor metrics and dimensions that you can use for your CloudWatch alarms and graphs.
Trusted Advisor check-level metrics
You can use the following metrics for Trusted Advisor checks.
| Metric | Description |
|---|---|
RedResources |
The number of resources that are in a red state (action recommended). |
YellowResources |
The number of resources that are in a yellow state (investigation recommended). |
Trusted Advisor service quota-level metrics
You can use the following metrics for Amazon Web Services service quotas.
| Metric | Description |
|---|---|
ServiceLimitUsage |
The percentage of resource usage against a service quota (formerly referred to as limits). |
Dimensions for check-level metrics
You can use the following dimension for Trusted Advisor checks.
| Dimension | Description |
|---|---|
CheckName |
The name of the Trusted Advisor check. You can find all check names in the Trusted Advisor console |
Dimensions for service quota metrics
You can use the following dimensions for Trusted Advisor service quota metrics.
| Dimension | Description |
|---|---|
Region |
The Amazon Web Services Region for a service quota. |
ServiceName |
The name of the Amazon Web Services service. |
ServiceLimit |
The name of the service quota. For more information about service quotas, see Amazon Web Services service quotas in the Amazon Web Services General Reference. |