Monitoring application health
When you are running a production website, it is important to know that your application is available and responding to requests. To assist with monitoring your application’s responsiveness, Elastic Beanstalk provides features where you can monitor statistics about your application and create alerts that trigger when thresholds are exceeded.
For information about the health monitoring provided by Elastic Beanstalk, see Basic health reporting.
You can access operational information about your application by using either the Amazon Toolkit for Visual Studio or the Amazon Management Console.
The toolkit displays your environment's status and application health in the Status field.
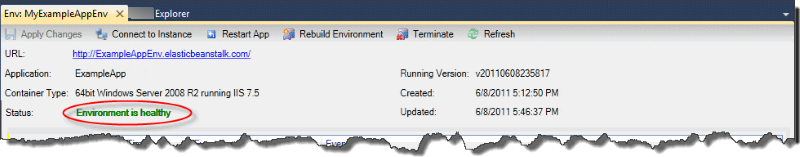
To monitor application health
-
In the Amazon Toolkit for Visual Studio, in Amazon Explorer, expand the Elastic Beanstalk node, and then expand your application node.
-
Right-click your Elastic Beanstalk environment, and then click View Status.
-
On your application environment tab, click Monitoring.
The Monitoring panel includes a set of graphs showing resource usage for your particular application environment.
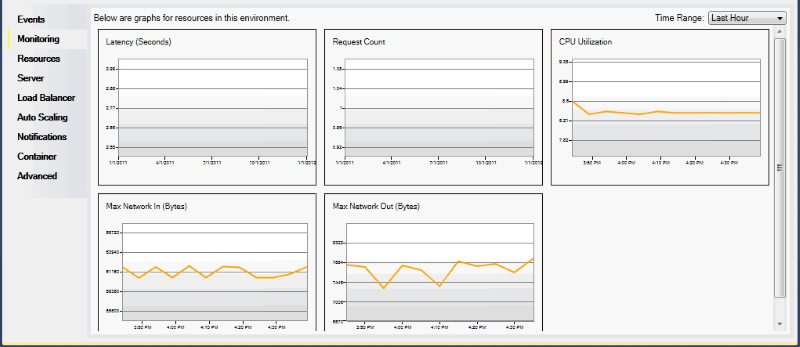
Note
By default, the time range is set to the last hour. To modify this setting, in the Time Range list, click a different time range.
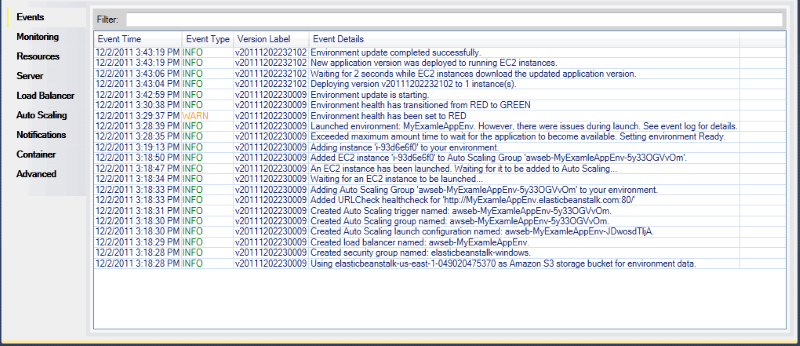
You can use the Amazon Toolkit for Visual Studio or the Amazon Management Console to view events associated with your application.
To view application events
-
In the Amazon Toolkit for Visual Studio, in Amazon Explorer, expand the Elastic Beanstalk node and your application node.
-
Right-click your Elastic Beanstalk environment in Amazon Explorer and then click View Status.
-
In your application environment tab, click Events.