Amazon Glue components
Amazon Glue provides a console and API operations to set up and manage your extract, transform, and load (ETL) workload. You can use API operations through several language-specific SDKs and the Amazon Command Line Interface (Amazon CLI). For information about using the Amazon CLI, see Amazon CLI Command Reference.
Amazon Glue uses the Amazon Glue Data Catalog to store metadata about data sources, transforms, and targets. The Data Catalog is a drop-in replacement for the Apache Hive Metastore. The Amazon Glue Jobs system provides a managed infrastructure for defining, scheduling, and running ETL operations on your data. For more information about the Amazon Glue API, see Amazon Glue API.
Amazon Glue console
You use the Amazon Glue console to define and orchestrate your ETL workflow. The console calls several API operations in the Amazon Glue Data Catalog and Amazon Glue Jobs system to perform the following tasks:
-
Define Amazon Glue objects such as jobs, tables, crawlers, and connections.
-
Schedule when crawlers run.
-
Define events or schedules for job triggers.
-
Search and filter lists of Amazon Glue objects.
-
Edit transformation scripts.
Amazon Glue Data Catalog
The Amazon Glue Data Catalog is your persistent technical metadata store in the Amazon Cloud.
Each Amazon account has one Amazon Glue Data Catalog per Amazon Region. Each Data Catalog is a highly scalable collection of tables organized into databases. A table is metadata representation of a collection of structured or semi-structured data stored in sources such as Amazon RDS, Apache Hadoop Distributed File System, Amazon OpenSearch Service, and others. The Amazon Glue Data Catalog provides a uniform repository where disparate systems can store and find metadata to keep track of data in data silos. You can then use the metadata to query and transform that data in a consistent manner across a wide variety of applications.
You use the Data Catalog together with Amazon Identity and Access Management policies and Lake Formation to control access to the tables and databases. By doing this, you can allow different groups in your enterprise to safely publish data to the wider organization while protecting sensitive information in a highly granular fashion.
The Data Catalog, along with CloudTrail and Lake Formation, also provides you with comprehensive audit and governance capabilities, with schema change tracking and data access controls. This helps ensure that data is not inappropriately modified or inadvertently shared.
For information about securing and auditing the Amazon Glue Data Catalog, see:
-
Amazon Lake Formation – For more information, see What Is Amazon Lake Formation? in the Amazon Lake Formation Developer Guide.
-
CloudTrail – For more information, see What Is CloudTrail? in the Amazon CloudTrail User Guide.
The following are other Amazon services and open-source projects that use the Amazon Glue Data Catalog:
-
Amazon Athena – For more information, see Understanding Tables, Databases, and the Data Catalog in the Amazon Athena User Guide.
-
Amazon Redshift Spectrum – For more information, see Using Amazon Redshift Spectrum to Query External Data in the Amazon Redshift Database Developer Guide.
-
Amazon EMR – For more information, see Use Resource-Based Policies for Amazon EMR Access to Amazon Glue Data Catalog in the Amazon EMR Management Guide.
-
Amazon Glue Data Catalog client for Apache Hive metastore – For more information about this GitHub project, see Amazon Glue Data Catalog Client for Apache Hive Metastore
.
Amazon Glue crawlers and classifiers
Amazon Glue also lets you set up crawlers that can scan data in all kinds of repositories, classify it, extract schema information from it, and store the metadata automatically in the Amazon Glue Data Catalog. The Amazon Glue Data Catalog can then be used to guide ETL operations.
For information about how to set up crawlers and classifiers, see Using crawlers to populate the Data Catalog. For information about how to program crawlers and classifiers using the Amazon Glue API, see Crawlers and classifiers API.
Amazon Glue ETL operations
Using the metadata in the Data Catalog, Amazon Glue can automatically generate Scala or PySpark (the Python API for Apache Spark) scripts with Amazon Glue extensions that you can use and modify to perform various ETL operations. For example, you can extract, clean, and transform raw data, and then store the result in a different repository, where it can be queried and analyzed. Such a script might convert a CSV file into a relational form and save it in Amazon Redshift.
For more information about how to use Amazon Glue ETL capabilities, see Programming Spark scripts.
Streaming ETL in Amazon Glue
Amazon Glue enables you to perform ETL operations on streaming data using continuously-running jobs. Amazon Glue streaming ETL is built on the Apache Spark Structured Streaming engine, and can ingest streams from Amazon Kinesis Data Streams, Apache Kafka, and Amazon Managed Streaming for Apache Kafka (Amazon MSK). Streaming ETL can clean and transform streaming data and load it into Amazon S3 or JDBC data stores. Use Streaming ETL in Amazon Glue to process event data like IoT streams, clickstreams, and network logs.
If you know the schema of the streaming data source, you can specify it in a Data Catalog table. If not, you can enable schema detection in the streaming ETL job. The job then automatically determines the schema from the incoming data.
The streaming ETL job can use both Amazon Glue built-in transforms and transforms that are
native to Apache Spark Structured Streaming. For more information, see Operations on streaming DataFrames/Datasets
For more information, see Streaming ETL jobs in Amazon Glue.
The Amazon Glue jobs system
The Amazon Glue Jobs system provides managed infrastructure to orchestrate your ETL workflow. You can create jobs in Amazon Glue that automate the scripts you use to extract, transform, and transfer data to different locations. Jobs can be scheduled and chained, or they can be triggered by events such as the arrival of new data.
For more information about using the Amazon Glue Jobs system, see Monitoring Amazon Glue. For information about programming using the Amazon Glue Jobs system API, see Jobs API.
Visual ETL components
Amazon Glue allows you to create ETL jobs through a visual canvas that you can manipulate.
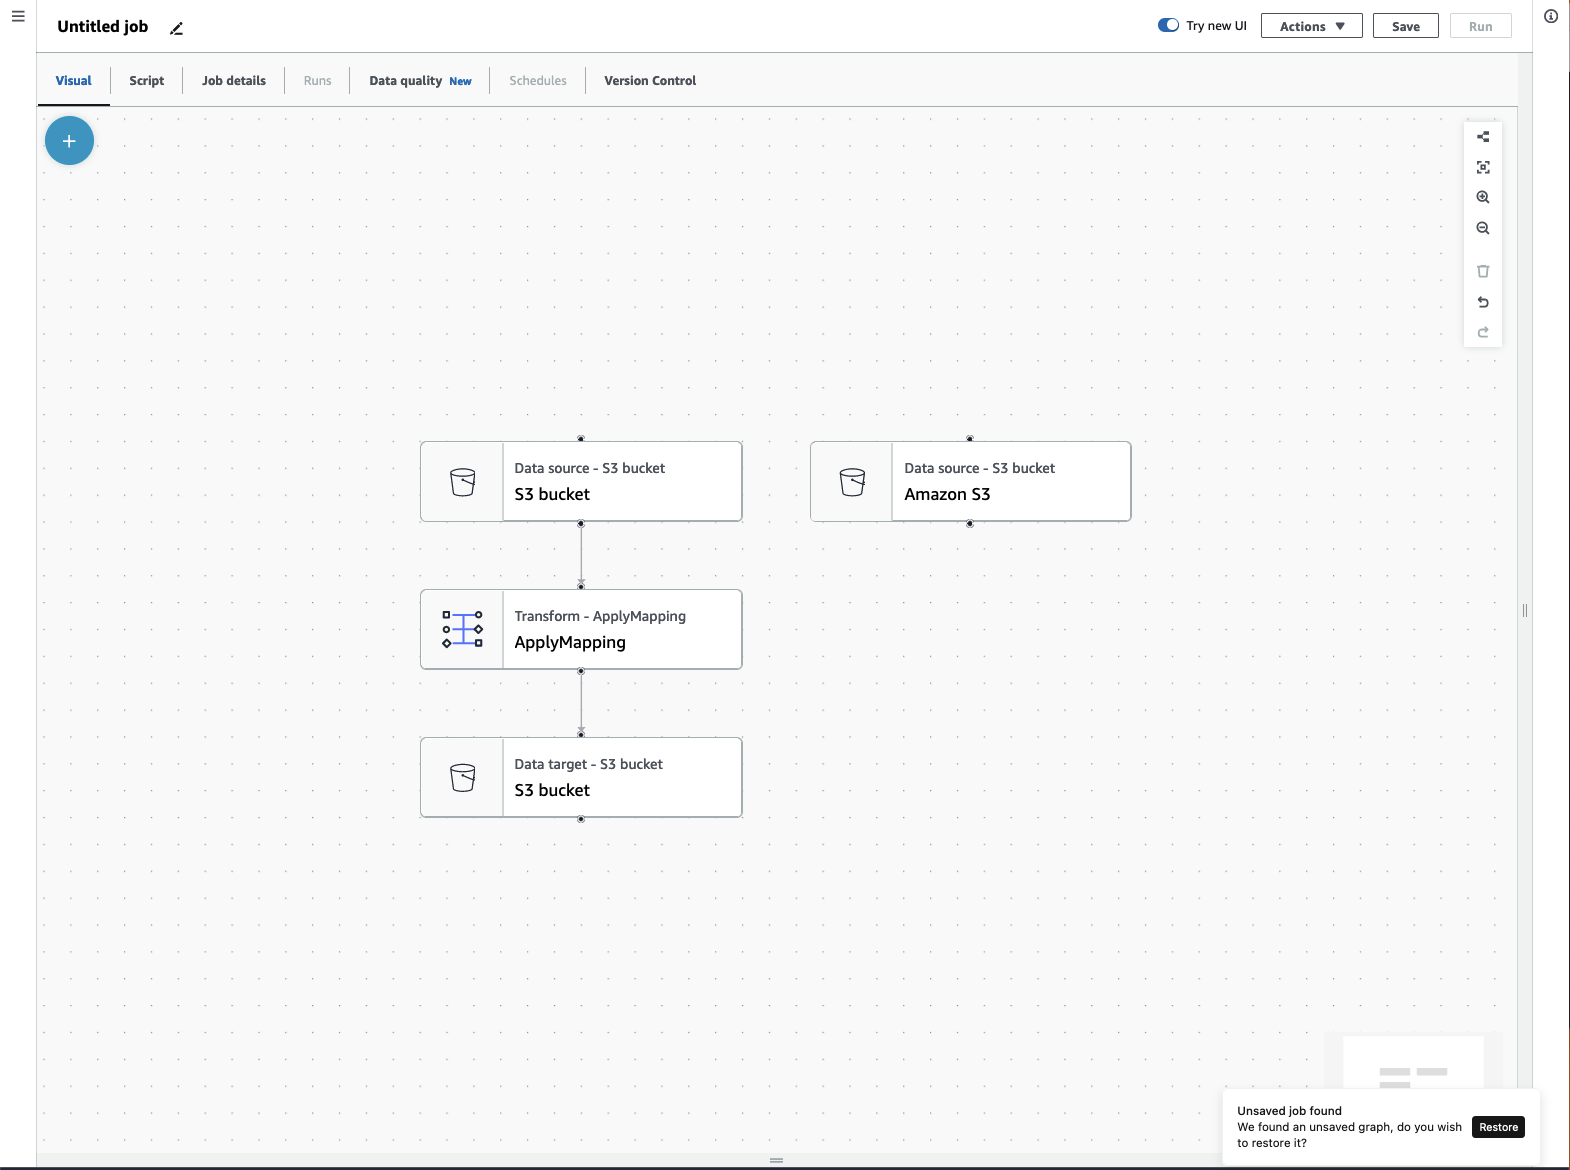
ETL job menu
Menu options at the top of the canvas allow you to access the various views and configuration details about your job.
-
Visual – The Visual job editor canvas. This is where you can add nodes to create a job.
-
Script – The script representation of your ETL job. Amazon Glue generates the script based on the visual representation of your job. You can also edit your script or download it.
Note
If you choose to edit the script, the job authoring experience is permanently converted to a script-only mode. Afterwards, you cannot use the visual editor to edit the job anymore. You should add all the job sources, transforms, and targets, and make all the changes you require with the visual editor before choosing to edit the script.
-
Job details – The Job details tab allows you to configure your job by setting job properties. There are basic properties, such as name and description of your job, IAM role, job type, Amazon Glue version, language, worker type, number of workers, job bookmark, flex execution, number of retires, and job timeout, and there are advanced properties, such as connections, libraries, job parameters, and tags.
-
Runs – After your job runs, this tab can be accessed to view your past job runs.
-
Data quality – Data quality evaluates and monitors the quality of your data assets. You can learn more about how to use data quality on this tab and add a data quality transform to your job.
-
Schedules – Jobs that you've scheduled appear in this tab. If there are no schedules attached to this job, then this tab is not accessible.
-
Version control – You can use Git with your job by configuring your job to a Git repository.
Visual ETL panels
When you work in the canvas, several panels are available to help you configure your nodes, or help you to preview your data and view the output schema.
-
Properties – The Properties panel appears when you choose a node on your canvas.
-
Data preview – The Data preview panel provides a preview of the data output so that you can make decisions before you run your job and examine your output.
-
Output schema – The Output schema tab allows you to view and edit the schema of your transform nodes.
Resizing panels
You can resize the Properties panel on the right-hand side of the screen and the bottom panel which contains the Data preview and Output schema tabs by clicking on the edge of the panel and dragging it left and right or up and down.
-
Properties panel – Resize the properties panel by clicking and dragging the edge of the canvas on the right side of the screen and drag it left to expand its width. By default, the panel is collapsed and when a node is selected, the properties panel opens up to its default size.
-
Data preview and Output schema panel – Resize the bottom panel by clicking and dragging the bottom edge of the canvas at the bottom of the screen and drag it up to expand its height. By default, the panel is collapsed and when a node is selected, the bottom panel opens up to its default size.
Job canvas
You can add, remove, and move/reorder nodes directly on the Visual ETL canvas. Think of it as your workspace to create a fully functional ETL job that starts with a data source and can end with a data target.
When you work with nodes on the canvas, you have a toolbar that can help you zoom in and out, remove nodes, make or edit connections between nodes, change the job flow orientation, and undo or redo an action.

The floating toolbar is anchored to the upper right-hand size of the canvas and contains several images that perform actions:
-
Layout icon – The first icon in the toolbar is the layout icon. By default, the direction of visual jobs is top to bottom.It rearranges the direction of your visual job by arranging the nodes horizontally from left to right. Clicking the layout icon again changes the direction back to top to bottom.
-
Recenter icon – The recenter icon changes the canvas view by centering it. You can use this with large jobs to get back to the center position.
-
Zoom in icon – The zoom in icon enlarges the size of the nodes on the canvas.
-
Zoom out icon – The zoom out icon decreases the size of the nodes on the canvas.
-
Trash icon – The trash icon removes a node from the visual job. You must select a node first.
-
Undo icon – The undo icon reverses the last action taken on the visual job.
-
Redo icon – The redo icon repeats the last action taken on the visual job.
Using the mini-map
Resource panel
The resource panel contains all of the data sources, transform actions, and connections available to you. Open the resource panel on the canvas by clicking the "+" icon. This will open the resource panel.
To close the resource panel, click the X in the upper-right hand corner of the resource panel. This will hide the panel until you're ready to open it again.
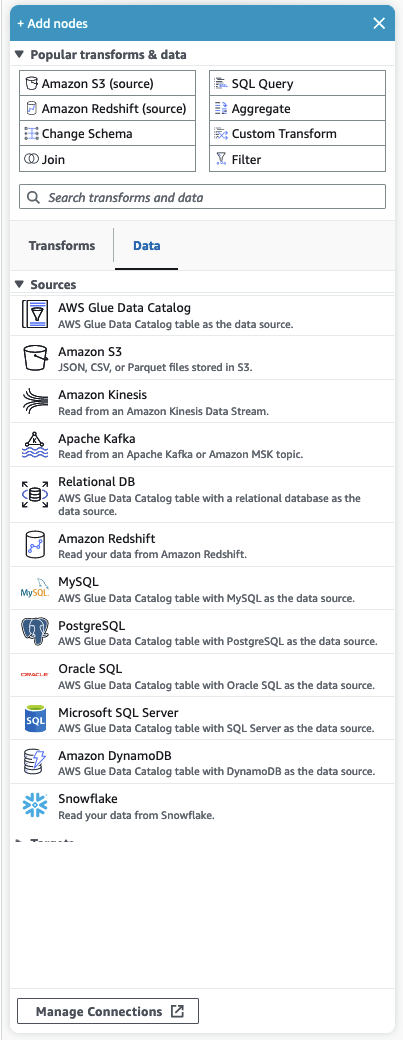
Popular transforms & data
At the top of the panel is a collection of Popular transforms & data. These nodes are commonly used in Amazon Glue. Choose one to add it to the canvas. You can also hide the Popular transforms & data by clicking the triangle next to the Popular transforms & data heading.
Beneath the Popular transforms & data section, you can search for transforms and data source nodes. Results appear as you type. The more letters you add to your search query, the list of results will get smaller. Search results are populated from the node name and/or description. Choose the node to add it to your canvas.
Transforms and Data
There are two tabs that organize the nodes into Transforms and Data.
Transforms – When you choose the Transforms tab, all of the available transforms can be selected. Choose a transform to add it to the canvas. You can also choose Add Transform at the bottom of the Transforms list which will open a new page to the documentation for creating Custom visual transforms. Following the steps will allow you to create transforms of your own. Your transforms will then appear in the list of available transforms.
Data – The data tab contains all of the nodes for Sources and Targets. You can hide the Sources and Targets by clicking the triangle next to the Sources or Targets heading. You can unhide the Sources and Targets by clicking the triangle again. Choose a source or target node to add it to the canvas. You can also choose Manage Connections to add a new connection. This will open the Connectors page in the console.