The SiteWise Monitor feature is not available to new customers. Existing customers can continue to use the service as normal. For more information, see SiteWise Monitor availability change
Get started as an Amazon IoT SiteWise Monitor project viewer
When you're invited to a project as a viewer, someone in your organization has set up a project and a set of dashboards to provide you with a consistent way to view data for your company's devices, equipment, and processes. In Amazon IoT SiteWise, those devices, equipment, and processes are referred to as assets. You can use Amazon IoT SiteWise Monitor to view the properties and alarms for a set of assets. Because the project owner has set up dashboards to visualize those properties, everyone who views the project has the dahboard view to draw insights from the data. As a project viewer, you can view all of the dashboards in the project. You can adjust the time range for the data shown in the dashboard. And you can explore the properties and alarms of individual assets to see a property or alarm that isn't on the dashboard.
You can only view the assets that are associated with the project to which you've been invited. To request additional assets, contact your project owner. The project owner can also update the dashboards to change the visualizations or show additional properties and alarms.
As a project viewer, you can do the following tasks:
Explore shared dashboards
As a viewer for one or more Amazon IoT SiteWise Monitor projects, you can view the dashboards to understand the data for your devices, equipment, and processes. You can adjust the time range for the visualizations in each dashboard to gain insights into your data.
The following procedure assumes that you are signed in the Amazon IoT SiteWise Monitor portal.
To explore shared dashboards
In the navigation bar, choose the Projects icon.

-
On the Projects page, choose the project whose dashboards you want to view.
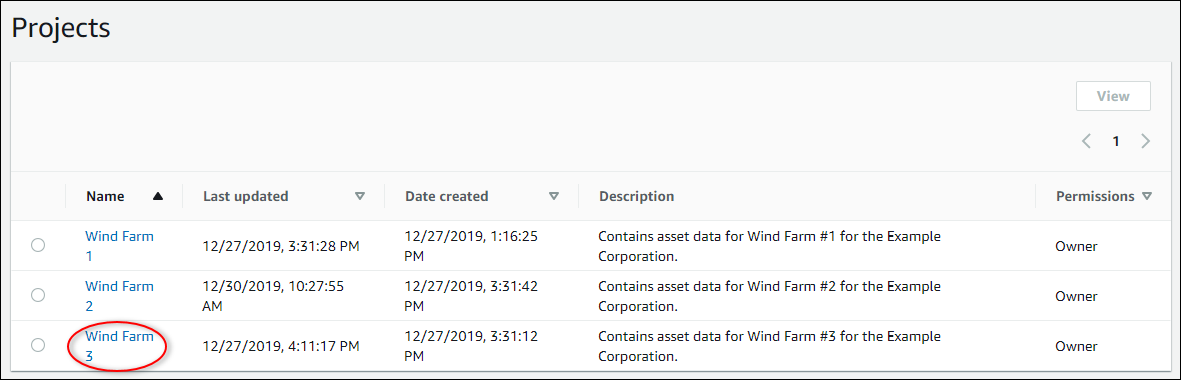
-
In the Dashboards section of the project details page, choose the name of the dashboard to view. You can also select the check box next to the dashboard, and then choose Open.
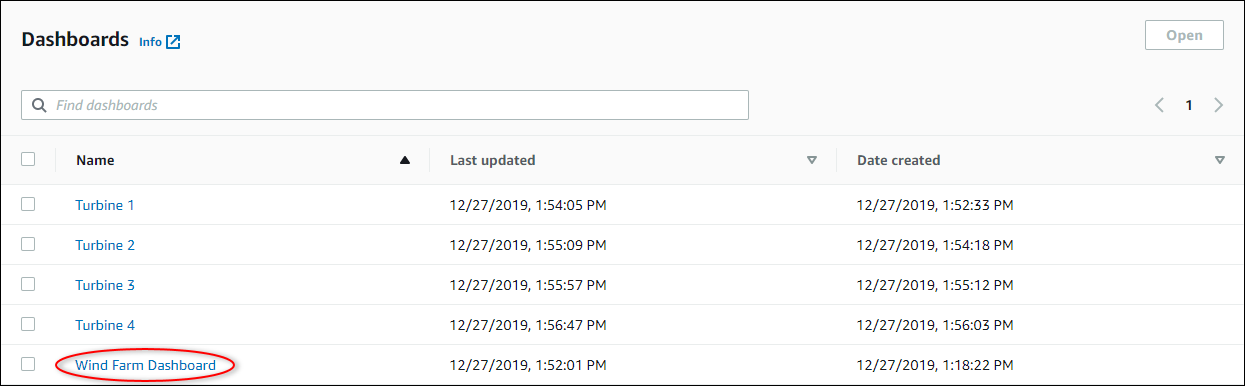
-
You can browse the visualizations in the dashboard.
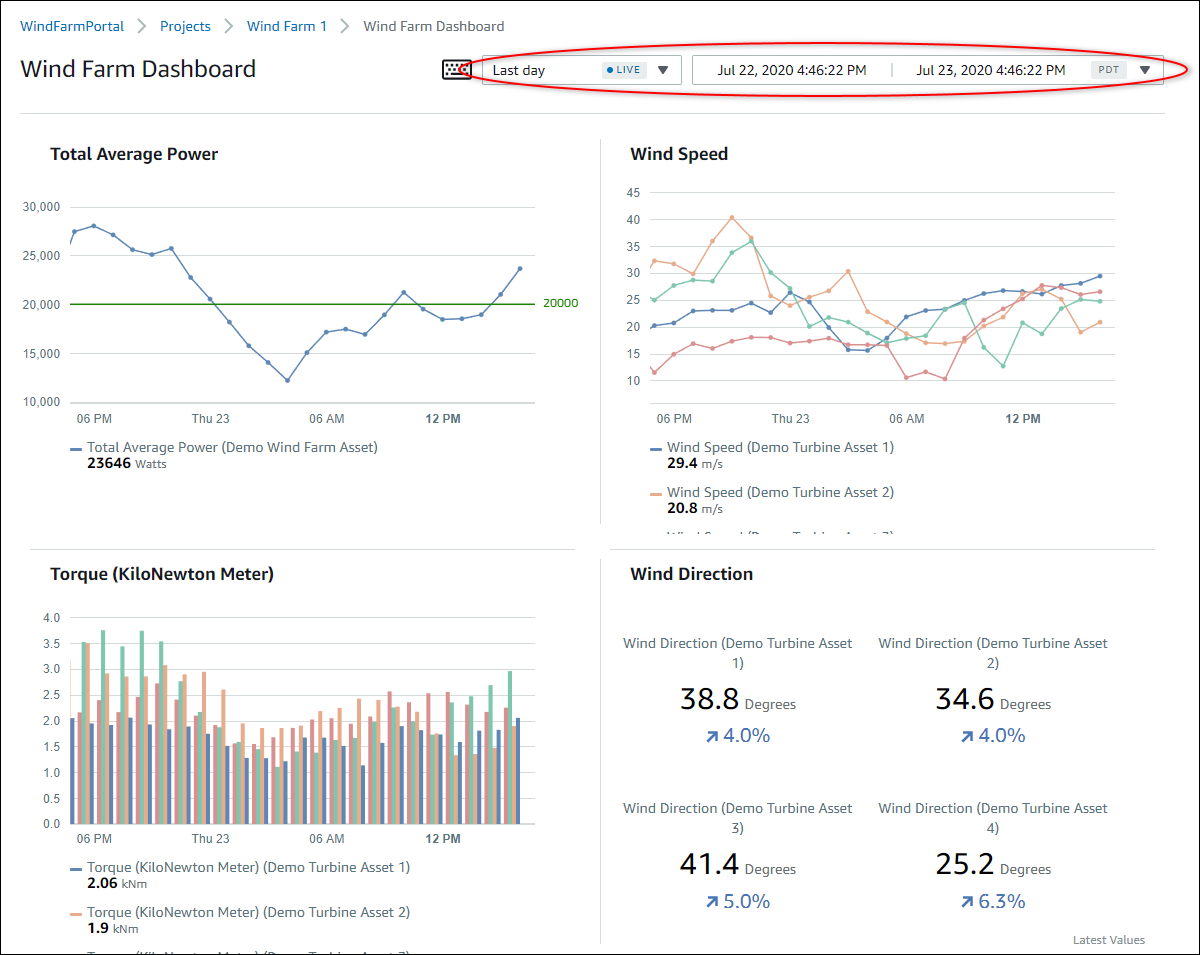
Do any of the following actions to adjust the displayed time range for your data:
-
Click and drag a time range on one of the line or bar charts to zoom in to the selected time range.
-
Double-click on a time range to zoom in on the selected point.
-
Press Shift and then double-click on a time range to zoom out from the selected point.
-
Press Shift and then drag the mouse on a time range to shift the range left or right.
-
Use the drop-down list to choose a predefined time range to view.
-
Use the time range control to open the calendar and specify a start and end time for your range.
Each visualization shows the latest reported value for the selected time range.
-
-
If you're a project owner or portal administrator, you can modify the dashboard. For more information see Add visualizations in Amazon IoT SiteWise Monitor.
Explore project assets and their data
While you will typically use the dashboards that the project owner prepared for you, you can also view properties and alarms for the assets included in a project. For example, you might check the model, install date, or location for a piece of equipment.
Note
As a project viewer, you can view only those assets that are contained in projects to which you have access.
The following procedure assumes that you signed in the Amazon IoT SiteWise Monitor portal.
To explore project assets and their data
-
In the navigation bar, choose the Assets icon.

The Assets page appears.
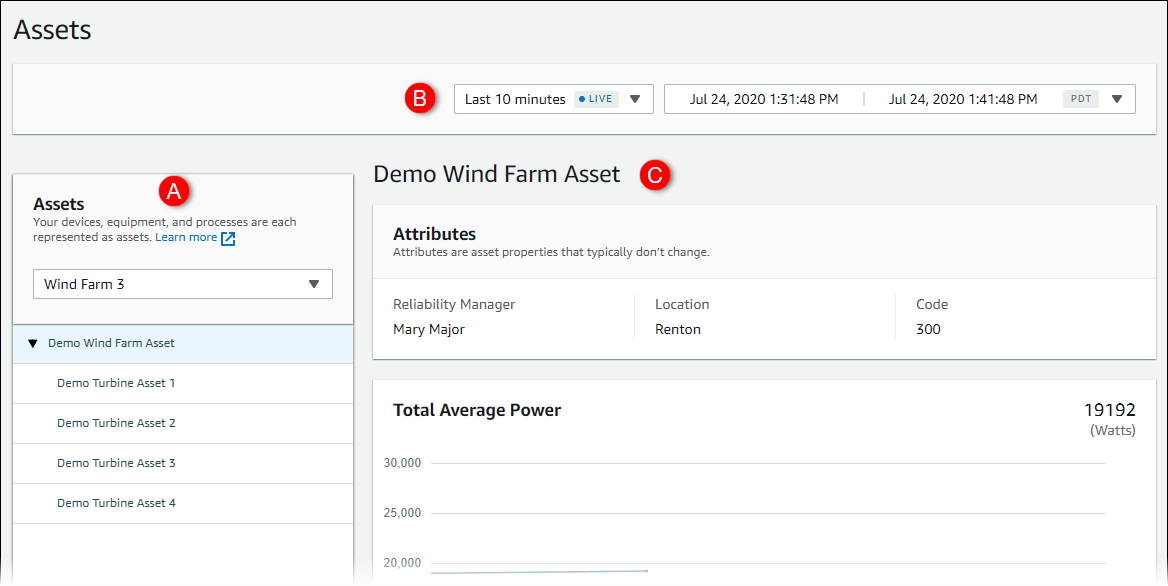
See the following areas of the page.
Callout Description A Browse the asset hierarchy to find assets to view. B Select the time range for the data shown for the properties of the selected assets. C View the values for the properties of the selected asset. View and respond to the alarms for the selected asset.