The SiteWise Monitor feature is not available to new customers. Existing customers can continue to use the service as normal. For more information, see SiteWise Monitor availability change
Add visualizations in Amazon IoT SiteWise Monitor
In Amazon IoT SiteWise Monitor, a dashboard is a group of visualizations. As a project owner, you decide which asset properties and alarms appear in each dashboard, and how they are best represented. For more information about the available visualization types, see Choose visualization types.
There are three steps to add a visualization to a dashboard:
-
Edit a dashboard – Open the dashboard for editing.
-
Drag a property or alarm to a dashboard – Drag a property or alarm to the dashboard.
-
Customize visualizations – Customize the visualization by choosing the ideal visualization and setting its properties and alarms.
Edit a dashboard
After you create a dashboard and add your visualizations, you can update your dashboard to change how it appears.
To edit a project's dashboard
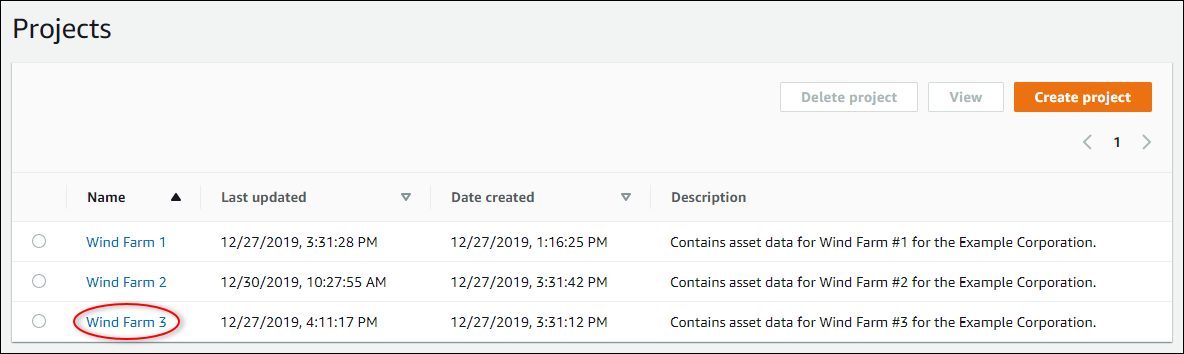
In the navigation bar, choose the Projects icon.

-
On the Projects page, choose the project whose dashboards you want to edit.
-
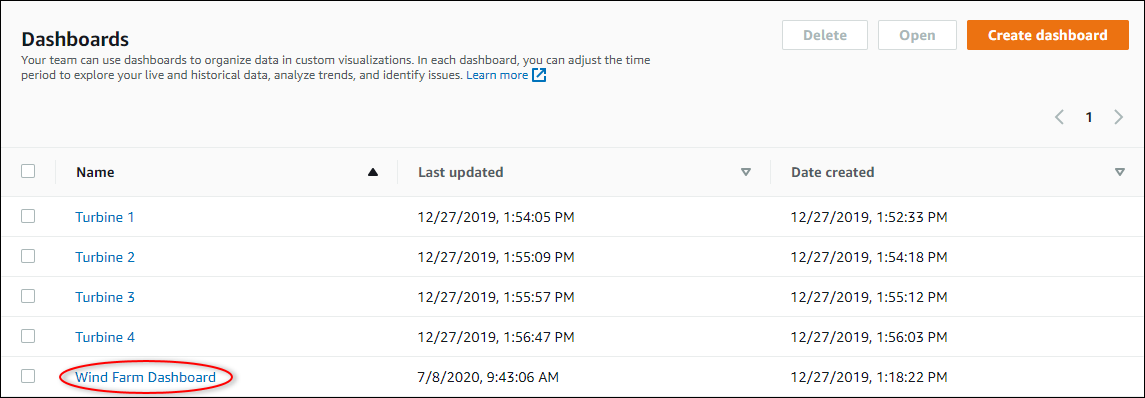
In the Dashboards section, choose a dashboard to edit.
-
In the dashboard, choose Edit in the upper right.
You can now rename the dashboard, or add, remove, or modify visualizations.
-
After you finish editing the dashboard, choose Save dashboard to save your changes. The dashboard editor closes. If you try to close a dashboard that has unsaved changes, you're prompted to save them.
Drag a property or alarm to a dashboard
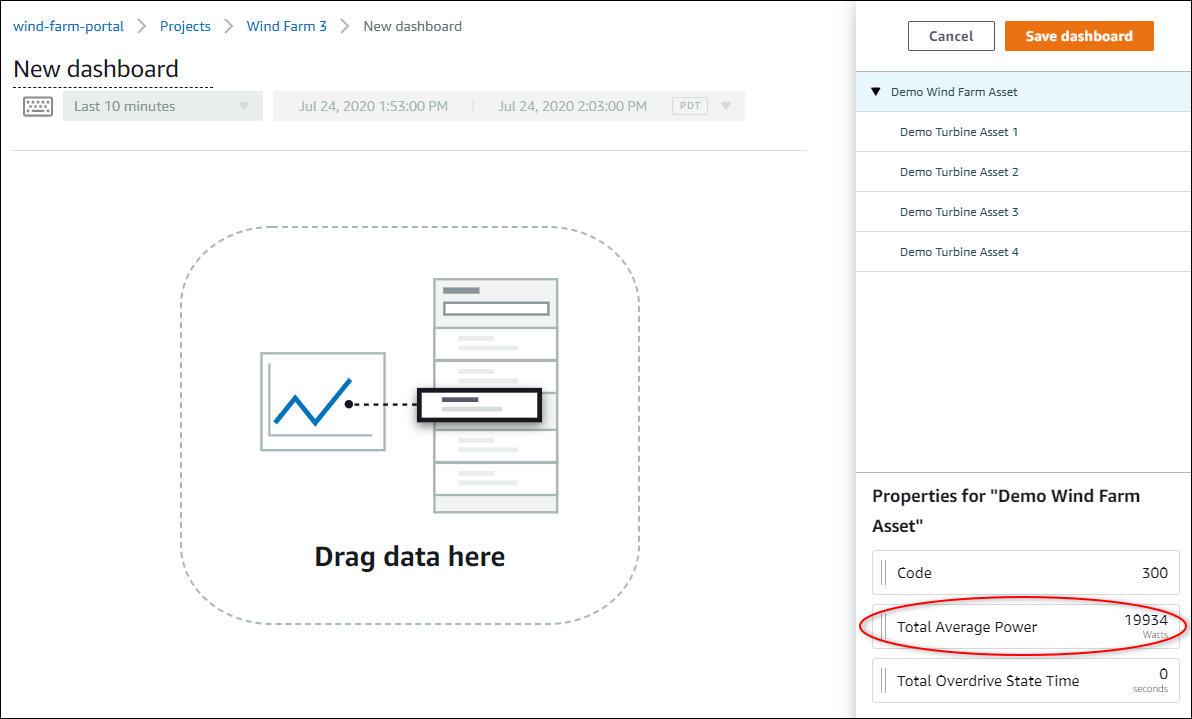
You add visualizations to the dashboard by dragging asset properties and alarms onto the dashboard. You can drag them onto an empty space to create a visualization or onto an existing visualization to add that property or alarm to those already in the visualization. You can add up to five asset properties or alarms to each visualization. Only portal administrators and project owners can edit dashboards. For more information about how to open a dashboard to change it, see Edit a dashboard.
-
Browse the list of project assets on the right side of the dashboard. When you find a property or alarm to visualize, drag it to the dashboard.
-
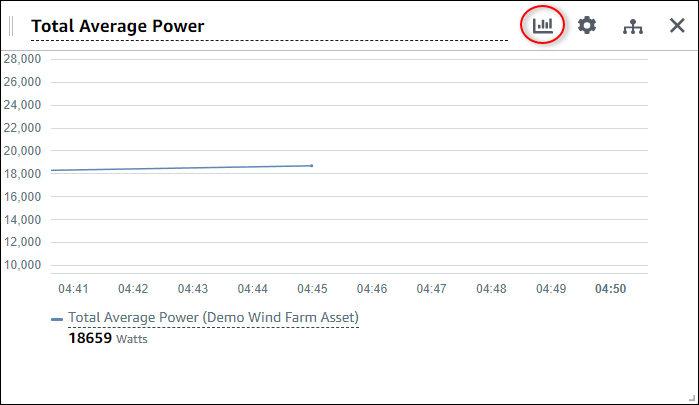
The default visualization type for properties is the line chart.
-
The default visualization type for alarms is the status grid widget.
Note
You can drag multiple properties and alarms onto a single visualization.
-
-
To change how your data displays, choose the visualization type.
For more information about the available visualization types, see Choose visualization types. To customize details of the visualization, see Customize visualizations.
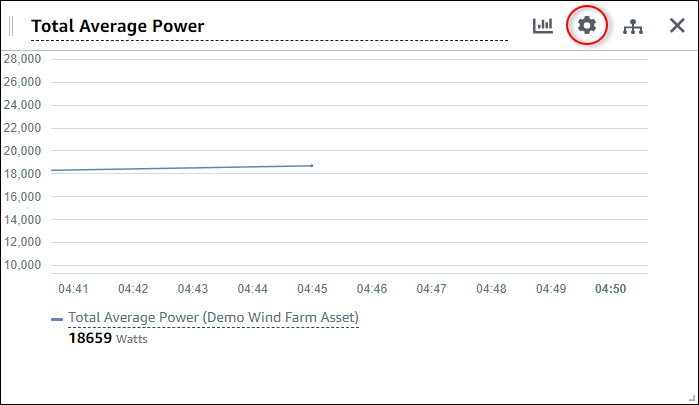
-
To add thresholds to your property, choose the visualization configuration icon. If you add a property that has an alarm, the visualization displays that alarm's threshold. For more information, see Configure thresholds.
-
To move or resize your visualization, see Adjust dashboard layout.