The SiteWise Monitor feature is not available to new customers. Existing customers can continue to use the service as normal. For more information, see SiteWise Monitor availability change
What is Amazon IoT SiteWise Monitor?
Amazon IoT SiteWise Monitor is a feature of Amazon IoT SiteWise that provides portals in the form of managed web applications. You can use these applications to view and share your operational data and alarms. You can see data from your processes, devices, and equipment that are connected to Amazon IoT SiteWise. Domain experts, such as process engineers, can use these portals to quickly get insights into their operational data to understand device and equipment behavior. They can use these insights to improve efficiency of devices, processes, or equipment and innovate on new initiatives. Operators can monitor data with alarms and respond to alarms when devices and equipment perform sub-optimally.
Because Amazon IoT SiteWise captures data over time, you can use Amazon IoT SiteWise Monitor to view operational data over time. With Amazon IoT SiteWise Monitor, you can uncover insights that might otherwise be difficult to find.
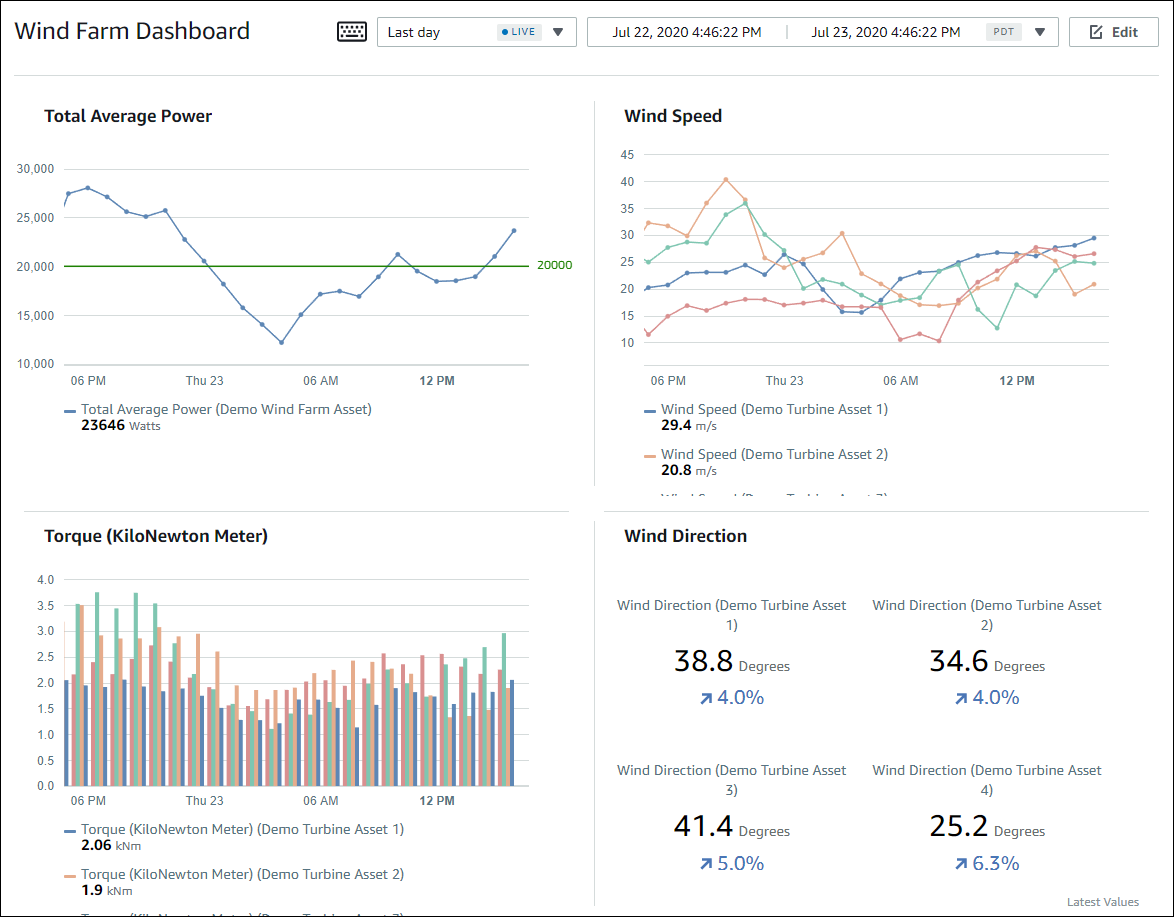
The following is an example dashboard that displays data for a wind farm.

SiteWise Monitor roles
Three roles use Amazon IoT SiteWise Monitor portals:
- Portal administrator
-
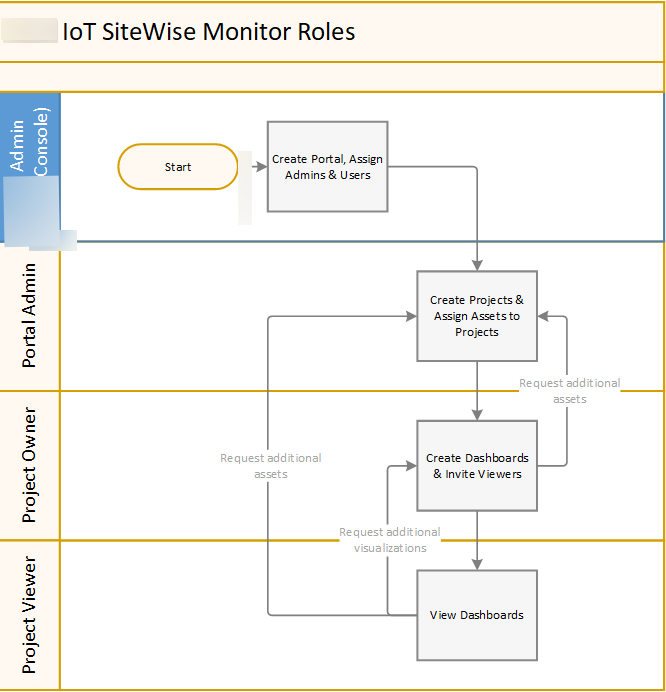
Each SiteWise Monitor portal has one or more portal administrators. Portal administrators use the portal to create projects that contain collections of assets and dashboards. The portal administrator then assigns assets and owners to each project. By controlling access to the project, portal administrators specify which assets that project owners and viewers can see.
- Project owner
-
Each SiteWise Monitor project has owners. Project owners create visualizations in the form of dashboards to represent operational data in a consistent manner. When dashboards are ready to share, the project owner can invite viewers to the project. Project owners can also assign other owners to the project. Project owners can configure thresholds and notification settings for alarms.
- Project viewer
-
Each SiteWise Monitor project has viewers. Project viewers can connect to the portal to view the dashboards that project owners created. In each dashboard, project viewers can adjust the time range to better understand operational data. Project viewers can only view dashboards in the projects to which they have access. Project viewers can acknowledge and snooze alarms.
Depending on your organization, the same person might perform multiple roles.
The following image illustrates how these three roles, in addition to the Amazon administrator who creates portals, interact in a SiteWise Monitor portal.

You can manage who has access to your data by using IAM. Your data users can sign in to SiteWise Monitor from a desktop or mobile browser using their IAM credentials.
Users other than the Amazon administrator can access portals when they receive a link to the portal.
SiteWise Monitor concepts
If you received an invitation to sign in to an Amazon IoT SiteWise Monitor portal, then you already have access to data from Amazon IoT SiteWise. To get the most benefit from the Amazon IoT SiteWise Monitor portal, you should be familiar with the following concepts:
- Portal
-
An Amazon IoT SiteWise Monitor portal is a web application that you can use to visualize and share your Amazon IoT SiteWise data. A portal has one or more administrators and contains zero or more projects.
- Project
-
Each SiteWise Monitor portal contains a set of projects. Each project has a subset of your Amazon IoT SiteWise assets associated with it. Project owners create one or more dashboards to provide a consistent way to view the data associated with those assets. Project owners can invite viewers to the project to allow them to view the assets and dashboards in the project. The project is the basic unit of sharing within SiteWise Monitor. Project owners can invite users who were given access to the portal by the Amazon administrator. A user must have access to a portal before a project in that portal can be shared with that user.
- Asset
-
When data is ingested into Amazon IoT SiteWise from your industrial equipment, your devices, equipment, and processes are each represented as assets. Each asset has properties and alarms associated with it. The portal administrator assigns sets of assets to each project.
- Property
-
Properties are time series data associated with assets. For example, a piece of equipment might have a serial number, a location, a make and model, and an install date. It might also have time series values for availability, performance, quality, temperature, pressure, and so on.
- Alarm
-
Alarms monitor properties to identify when equipment is outside of its operating range. Each alarm defines a threshold and a property to monitor. When the property exceeds the threshold, the alarm becomes active and indicates that you or someone on your team should address the issue. Project owners can customize the thresholds and notification settings for alarms. Project viewers can acknowledge and snooze alarms, and they can leave a message with details about the alarm or the action that they took to address it.
- Dashboard
-
Each project contains a set of dashboards. Dashboards provide a set of visualizations for the values of a set of assets. Project owners create the dashboards and the visualizations that it contains. When a project owner is ready to share the set of dashboards, the owner can invite viewers to the project, which gives them access to all dashboards in the project. If you want a different set of viewers for different dashboards, you must divide the dashboards between projects. When viewers look at dashboards, they can customize time range to look at specific data.
- Visualization
-
In each dashboard, project owners decide how to display the properties and alarms of the assets associated with the project. Availability might be represented as a line chart, while other values might be displayed as bar charts or key performance indicators (KPIs). Alarms are best displayed as status grids and status timelines. Project owners customize each visualization to provide the best understanding of the data for that asset.