After careful consideration, we have decided to discontinue Amazon Kinesis Data Analytics for SQL applications:
1. From September 1, 2025, we won't provide any bug fixes for Amazon Kinesis Data Analytics for SQL applications because we will have limited support for it, given the upcoming discontinuation.
2. From October 15, 2025, you will not be able to create new Kinesis Data Analytics for SQL applications.
3. We will delete your applications starting January 27, 2026. You will not be able to start or operate your Amazon Kinesis Data Analytics for SQL applications. Support will no longer be available for Amazon Kinesis Data Analytics for SQL from that time. For more information, see Amazon Kinesis Data Analytics for SQL Applications discontinuation.
Example: Stagger Window
When a windowed query processes separate windows for each unique partition key,
starting when data with the matching key arrives, the window is referred to as a
stagger window. For details, see Stagger Windows. This
Amazon Kinesis Data Analytics example uses the EVENT_TIME and TICKER columns to create stagger windows. The
source stream contains groups of six records with identical EVENT_TIME and TICKER values
that arrive within in a one-minute period, but not necessarily with the same minute
value (for example, 18:41:xx).
In this example, you write the following records to a Kinesis data stream at the
following times. The script does not write the times to the stream, but the time that
the record is ingested by the application is written to the ROWTIME
field:
{"EVENT_TIME": "2018-08-01T20:17:20.797945", "TICKER": "AMZN"}   20:17:30
{"EVENT_TIME": "2018-08-01T20:17:20.797945", "TICKER": "AMZN"}   20:17:40
{"EVENT_TIME": "2018-08-01T20:17:20.797945", "TICKER": "AMZN"}   20:17:50
{"EVENT_TIME": "2018-08-01T20:17:20.797945", "TICKER": "AMZN"}   20:18:00
{"EVENT_TIME": "2018-08-01T20:17:20.797945", "TICKER": "AMZN"}   20:18:10
{"EVENT_TIME": "2018-08-01T20:17:20.797945", "TICKER": "AMZN"}   20:18:21
{"EVENT_TIME": "2018-08-01T20:18:21.043084", "TICKER": "INTC"}   20:18:31
{"EVENT_TIME": "2018-08-01T20:18:21.043084", "TICKER": "INTC"}   20:18:41
{"EVENT_TIME": "2018-08-01T20:18:21.043084", "TICKER": "INTC"}   20:18:51
{"EVENT_TIME": "2018-08-01T20:18:21.043084", "TICKER": "INTC"}   20:19:01
{"EVENT_TIME": "2018-08-01T20:18:21.043084", "TICKER": "INTC"}   20:19:11
{"EVENT_TIME": "2018-08-01T20:18:21.043084", "TICKER": "INTC"}   20:19:21
...
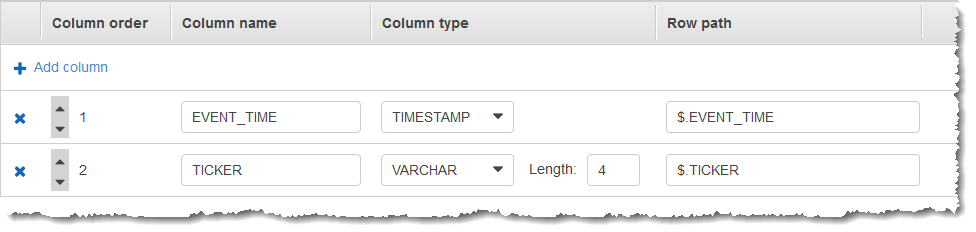
You then create a Kinesis Data Analytics application in the Amazon Web Services Management Console, with the Kinesis data stream as the
streaming source. The discovery process reads sample records on the streaming source and
infers an in-application schema with two columns (EVENT_TIME and
TICKER) as shown following.
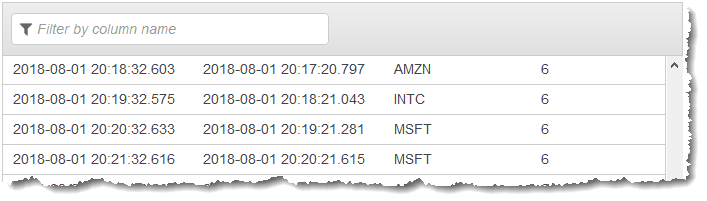
You use the application code with the COUNT function
to create a windowed aggregation of the data. Then you insert the resulting data into
another in-application stream, as shown in the following screenshot:
In the following procedure, you create a Kinesis Data Analytics application that aggregates values in the input stream in a stagger window based on EVENT_TIME and TICKER.
Step 1: Create a Kinesis Data Stream
Create an Amazon Kinesis data stream and populate the records as follows:
Sign in to the Amazon Web Services Management Console and open the Kinesis console at https://console.amazonaws.cn/kinesis
. -
Choose Data Streams in the navigation pane.
-
Choose Create Kinesis stream, and then create a stream with one shard. For more information, see Create a Stream in the Amazon Kinesis Data Streams Developer Guide.
-
To write records to a Kinesis data stream in a production environment, we recommend using either the Kinesis Producer Library or Kinesis Data Streams API. For simplicity, this example uses the following Python script to generate records. Run the code to populate the sample ticker records. This simple code continuously writes a group of six records with the same random
EVENT_TIMEand ticker symbol to the stream, over the course of one minute. Keep the script running so that you can generate the application schema in a later step.import datetime import json import random import time import boto3 STREAM_NAME = "ExampleInputStream" def get_data(): event_time = datetime.datetime.utcnow() - datetime.timedelta(seconds=10) return { "EVENT_TIME": event_time.isoformat(), "TICKER": random.choice(["AAPL", "AMZN", "MSFT", "INTC", "TBV"]), } def generate(stream_name, kinesis_client): while True: data = get_data() # Send six records, ten seconds apart, with the same event time and ticker for _ in range(6): print(data) kinesis_client.put_record( StreamName=stream_name, Data=json.dumps(data), PartitionKey="partitionkey", ) time.sleep(10) if __name__ == "__main__": generate(STREAM_NAME, boto3.client("kinesis"))
Step 2: Create the Kinesis Data Analytics Application
Create a Kinesis Data Analytics application as follows:
Open the Managed Service for Apache Flink console at https://console.amazonaws.cn/kinesisanalytics
. -
Choose Create application, type an application name, and choose Create application.
-
On the application details page, choose Connect streaming data to connect to the source.
-
On the Connect to source page, do the following:
-
Choose the stream that you created in the preceding section.
-
Choose Discover Schema. Wait for the console to show the inferred schema and samples records that are used to infer the schema for the in-application stream created. The inferred schema has two columns.
-
Choose Edit Schema. Change the Column type of the EVENT_TIME column to
TIMESTAMP. -
Choose Save schema and update stream samples. After the console saves the schema, choose Exit.
-
Choose Save and continue.
-
-
On the application details page, choose Go to SQL editor. To start the application, choose Yes, start application in the dialog box that appears.
-
In the SQL editor, write the application code, and verify the results as follows:
-
Copy the following application code and paste it into the editor.
CREATE OR REPLACE STREAM "DESTINATION_SQL_STREAM" ( event_time TIMESTAMP, ticker_symbol VARCHAR(4), ticker_count INTEGER); CREATE OR REPLACE PUMP "STREAM_PUMP" AS INSERT INTO "DESTINATION_SQL_STREAM" SELECT STREAM EVENT_TIME, TICKER, COUNT(TICKER) AS ticker_count FROM "SOURCE_SQL_STREAM_001" WINDOWED BY STAGGER ( PARTITION BY TICKER, EVENT_TIME RANGE INTERVAL '1' MINUTE); -
Choose Save and run SQL.
On the Real-time analytics tab, you can see all the in-application streams that the application created and verify the data.
-