Tracing TypeScript code in Amazon Lambda
Lambda integrates with Amazon X-Ray to help you trace, debug, and optimize Lambda applications. You can use X-Ray to trace a request as it traverses resources in your application, which may include Lambda functions and other Amazon services.
To send tracing data to X-Ray, you can use one of three SDK libraries:
-
Amazon Distro for OpenTelemetry (ADOT)
– A secure, production-ready, Amazon-supported distribution of the OpenTelemetry (OTel) SDK. -
Amazon X-Ray SDK for Node.js – An SDK for generating and sending trace data to X-Ray.
-
Powertools for Amazon Lambda (TypeScript)
– A developer toolkit to implement Serverless best practices and increase developer velocity.
Each of the SDKs offer ways to send your telemetry data to the X-Ray service. You can then use X-Ray to view, filter, and gain insights into your application's performance metrics to identify issues and opportunities for optimization.
Important
The X-Ray and Powertools for Amazon Lambda SDKs are part of a tightly integrated instrumentation solution offered by Amazon. The ADOT Lambda Layers are part of an industry-wide standard for tracing instrumentation that collect more data in general, but may not be suited for all use cases. You can implement end-to-end tracing in X-Ray using either solution. To learn more about choosing between them, see Choosing between the Amazon Distro for Open Telemetry and X-Ray SDKs.
Sections
Using Powertools for Amazon Lambda (TypeScript) and Amazon SAM for tracing
Follow the steps below to download, build, and deploy a sample Hello World TypeScript application with integrated Powertools for Amazon Lambda (TypeScript)hello world message.
Prerequisites
To complete the steps in this section, you must have the following:
-
Node.js
-
Amazon SAM CLI version 1.75 or later. If you have an older version of the Amazon SAM CLI, see Upgrading the Amazon SAM CLI.
Deploy a sample Amazon SAM application
-
Initialize the application using the Hello World TypeScript template.
sam init --app-template hello-world-powertools-typescript --name sam-app --package-type Zip --runtime nodejs24.x --no-tracing -
Build the app.
cd sam-app && sam build -
Deploy the app.
sam deploy --guided -
Follow the on-screen prompts. To accept the default options provided in the interactive experience, press
Enter.Note
For HelloWorldFunction may not have authorization defined, Is this okay?, make sure to enter
y. -
Get the URL of the deployed application:
aws cloudformation describe-stacks --stack-name sam-app --query 'Stacks[0].Outputs[?OutputKey==`HelloWorldApi`].OutputValue' --output text -
Invoke the API endpoint:
curl<URL_FROM_PREVIOUS_STEP>If successful, you'll see this response:
{"message":"hello world"} -
To get the traces for the function, run sam traces.
sam tracesThe trace output looks like this:
XRay Event [revision 1] at (2023-01-31T11:29:40.527000) with id (1-11a2222-111a222222cb33de3b95daf9) and duration (0.483s) - 0.425s - sam-app/Prod [HTTP: 200] - 0.422s - Lambda [HTTP: 200] - 0.406s - sam-app-HelloWorldFunction-Xyzv11a1bcde [HTTP: 200] - 0.172s - sam-app-HelloWorldFunction-Xyzv11a1bcde - 0.179s - Initialization - 0.112s - Invocation - 0.052s - ## app.lambdaHandler - 0.001s - ### MySubSegment - 0.059s - Overhead -
This is a public API endpoint that is accessible over the internet. We recommend that you delete the endpoint after testing.
sam delete
X-Ray doesn't trace all requests to your application. X-Ray applies a sampling algorithm to ensure that tracing is efficient, while still providing a representative sample of all requests. The sampling rate is 1 request per second and 5 percent of additional requests. You can't configure the X-Ray sampling rate for your functions.
Using Powertools for Amazon Lambda (TypeScript) and the Amazon CDK for tracing
Follow the steps below to download, build, and deploy a sample Hello World TypeScript application with integrated Powertools for Amazon Lambda (TypeScript)hello world message.
Prerequisites
To complete the steps in this section, you must have the following:
-
Node.js
-
Amazon SAM CLI version 1.75 or later. If you have an older version of the Amazon SAM CLI, see Upgrading the Amazon SAM CLI.
Deploy a sample Amazon Cloud Development Kit (Amazon CDK) application
-
Create a project directory for your new application.
mkdir hello-world cd hello-world -
Initialize the app.
cdk init app --language typescript -
Add the @types/aws-lambda
package as a development dependency. npm install -D @types/aws-lambda -
Install the Powertools Tracer utility
. npm install @aws-lambda-powertools/tracer -
Open the lib directory. You should see a file called hello-world-stack.ts. Create new two new files in this directory: hello-world.function.ts and hello-world.ts.
-
Open hello-world.function.ts and add the following code to the file. This is the code for the Lambda function.
import { APIGatewayEvent, APIGatewayProxyResult, Context } from 'aws-lambda'; import { Tracer } from '@aws-lambda-powertools/tracer'; const tracer = new Tracer(); export const handler = async (event: APIGatewayEvent, context: Context): Promise<APIGatewayProxyResult> => { // Get facade segment created by Lambda const segment = tracer.getSegment(); // Create subsegment for the function and set it as active const handlerSegment = segment.addNewSubsegment(`## ${process.env._HANDLER}`); tracer.setSegment(handlerSegment); // Annotate the subsegment with the cold start and serviceName tracer.annotateColdStart(); tracer.addServiceNameAnnotation(); // Add annotation for the awsRequestId tracer.putAnnotation('awsRequestId', context.awsRequestId); // Create another subsegment and set it as active const subsegment = handlerSegment.addNewSubsegment('### MySubSegment'); tracer.setSegment(subsegment); let response: APIGatewayProxyResult = { statusCode: 200, body: JSON.stringify({ message: 'hello world', }), }; // Close subsegments (the Lambda one is closed automatically) subsegment.close(); // (### MySubSegment) handlerSegment.close(); // (## index.handler) // Set the facade segment as active again (the one created by Lambda) tracer.setSegment(segment); return response; }; -
Open hello-world.ts and add the following code to the file. This contains the NodejsFunction construct, which creates the Lambda function, configures environment variables for Powertools, and sets log retention to one week. It also includes the LambdaRestApi construct, which creates the REST API.
import { Construct } from 'constructs'; import { NodejsFunction } from 'aws-cdk-lib/aws-lambda-nodejs'; import { LambdaRestApi } from 'aws-cdk-lib/aws-apigateway'; import { CfnOutput } from 'aws-cdk-lib'; import { Tracing } from 'aws-cdk-lib/aws-lambda'; export class HelloWorld extends Construct { constructor(scope: Construct, id: string) { super(scope, id); const helloFunction = new NodejsFunction(this, 'function', { environment: { POWERTOOLS_SERVICE_NAME: 'helloWorld', }, tracing: Tracing.ACTIVE, }); const api = new LambdaRestApi(this, 'apigw', { handler: helloFunction, }); new CfnOutput(this, 'apiUrl', { exportName: 'apiUrl', value: api.url, }); } } -
Open hello-world-stack.ts. This is the code that defines your Amazon CDK stack. Replace the code with the following:
import { Stack, StackProps } from 'aws-cdk-lib'; import { Construct } from 'constructs'; import { HelloWorld } from './hello-world'; export class HelloWorldStack extends Stack { constructor(scope: Construct, id: string, props?: StackProps) { super(scope, id, props); new HelloWorld(this, 'hello-world'); } } -
Deploy your application.
cd .. cdk deploy -
Get the URL of the deployed application:
aws cloudformation describe-stacks --stack-name HelloWorldStack --query 'Stacks[0].Outputs[?ExportName==`apiUrl`].OutputValue' --output text -
Invoke the API endpoint:
curl<URL_FROM_PREVIOUS_STEP>If successful, you'll see this response:
{"message":"hello world"} -
To get the traces for the function, run sam traces.
sam tracesThe trace output looks like this:
XRay Event [revision 1] at (2023-01-31T11:50:06.997000) with id (1-11a2222-111a222222cb33de3b95daf9) and duration (0.449s) - 0.350s - HelloWorldStack-helloworldfunction111A2BCD-Xyzv11a1bcde [HTTP: 200] - 0.157s - HelloWorldStack-helloworldfunction111A2BCD-Xyzv11a1bcde - 0.169s - Initialization - 0.058s - Invocation - 0.055s - ## index.handler - 0.000s - ### MySubSegment - 0.099s - Overhead -
This is a public API endpoint that is accessible over the internet. We recommend that you delete the endpoint after testing.
cdk destroy
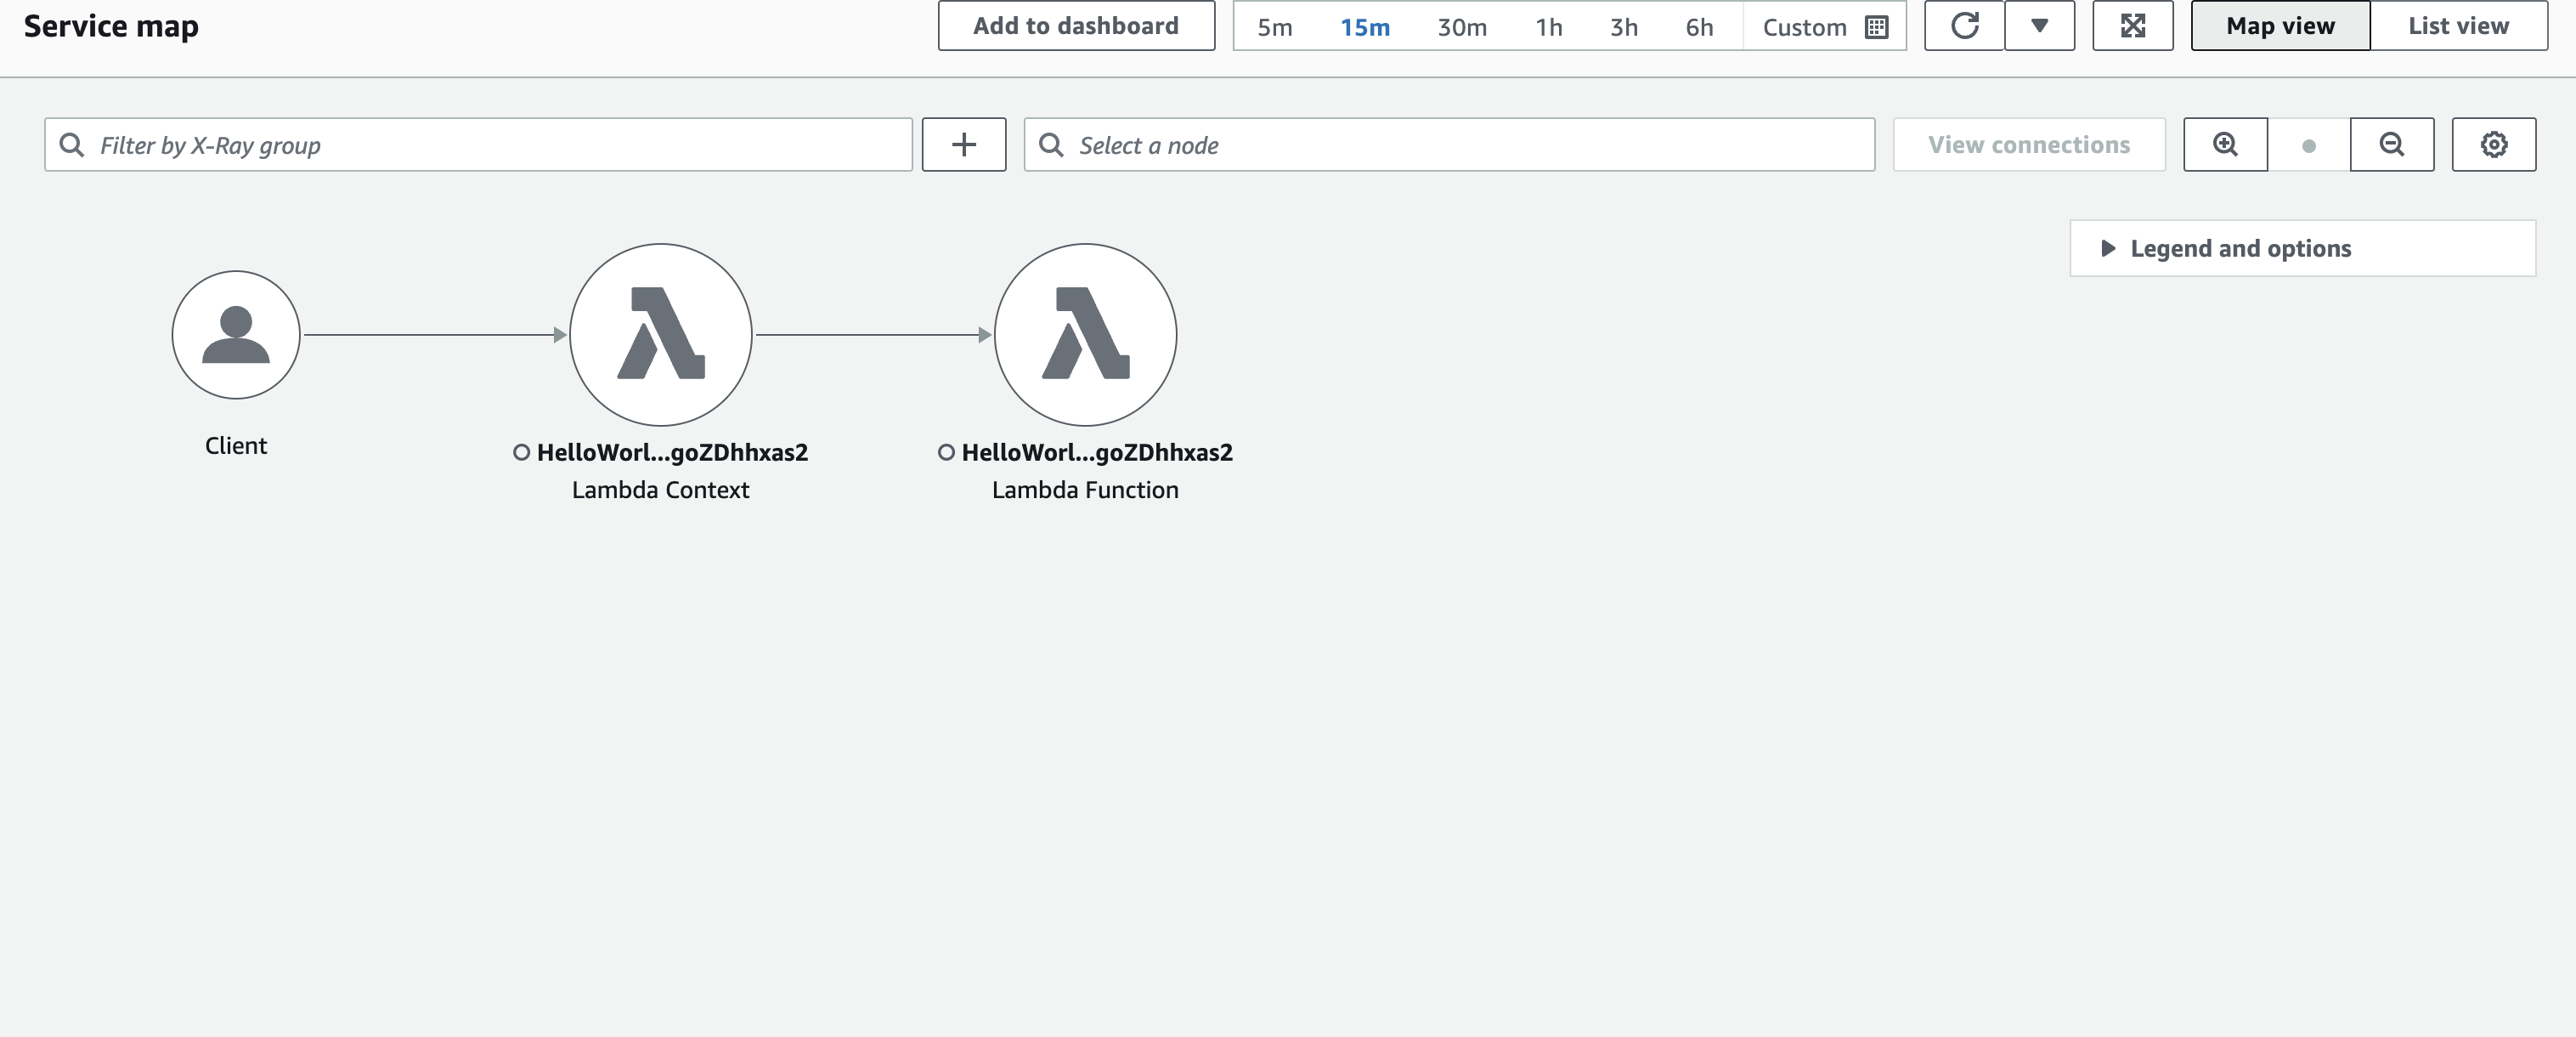
Interpreting an X-Ray trace
After you've configured active tracing, you can observe specific requests through your application. The X-Ray trace map provides information about your application and all its components. The following example shows a trace from the sample application: