Checkpoints
Checkpoints are Flink’s mechanism to ensure that the state of an application is fault tolerant. The mechanism allows Flink to recover the state of operators if the job fails and gives the application the same semantics as failure-free execution. With Managed Service for Apache Flink, the state of an application is stored in RocksDB, an embedded key/value store that keeps its working state on disk. When a checkpoint is taken the state is also uploaded to Amazon S3 so even if the disk is lost then the checkpoint can be used to restore the applications state.
For more information, see How does State Snapshotting Work?
Checkpointing stages
For a checkpointing operator subtask in Flink there are 5 main stages:
Waiting [Start Delay] – Flink uses checkpoint barriers that get inserted into the stream so time in this stage is the time the operator waits for the checkpoint barrier to reach it.
Alignment [Alignment Duration] – In this stage the subtask has reached one barrier but it’s waiting for barriers from other input streams.
Sync checkpointing [Sync Duration] – This stage is when the subtask actually snapshots the state of the operator and blocks all other activity on the subtask.
Async checkpointing [Async Duration] – The majority of this stage is the subtask uploading the state to Amazon S3. During this stage, the subtask is no longer blocked and can process records.
Acknowledging – This is usually a short stage and is simply the subtask sending an acknowledgement to the JobManager and also performing any commit messages (e.g. with Kafka sinks).
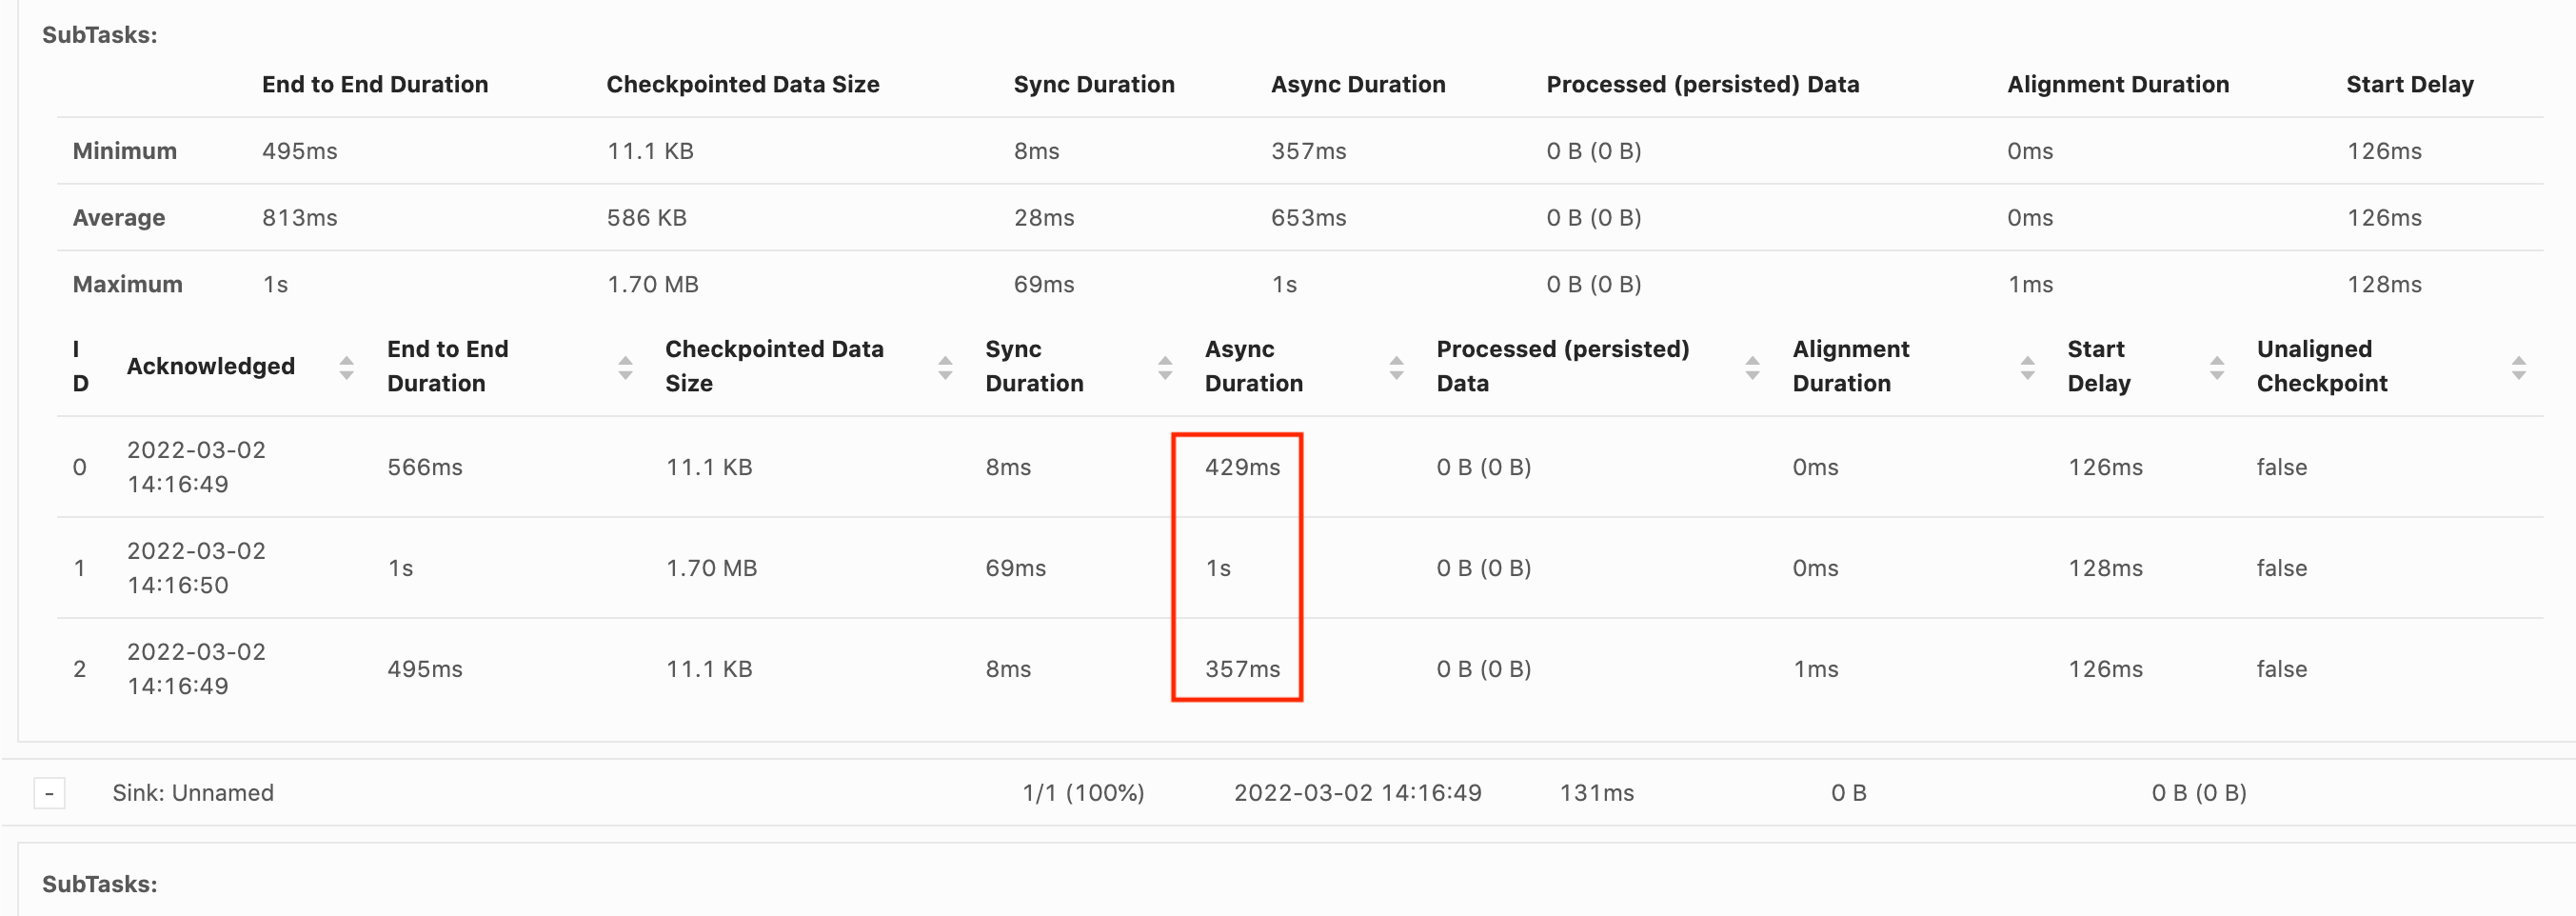
Each of these stages (apart from Acknowledging) maps to a duration metric for checkpoints that is available from the Flink WebUI, which can help isolate the cause of the long checkpoint.
To see an exact definition of each of the metrics available on checkpoints, go to History Tab
Investigating
When investigating long checkpoint duration, the most important thing to determine is the bottleneck for the checkpoint, i.e.,
what operator and subtask is taking the longest to checkpoint and which stage of that subtask is taking an extended period of time.
This can be determined using the Flink WebUI under the jobs checkpoint task. Flink’s Web interface provides data and information
that helps to investigate checkpointing issues. For a full breakdown, see Monitoring Checkpointing
The first thing to look at is the End to End Duration of each operator in the Job graph to determine which operator is taking long to checkpoint and warrants further investigation. Per the Flink documentation, the definition of the duration is:
The duration from the trigger timestamp until the latest acknowledgement (or n/a if no acknowledgement received yet). This end to end duration for a complete checkpoint is determined by the last subtask that acknowledges the checkpoint. This time is usually larger than single subtasks need to actually checkpoint the state.
The other durations for the checkpoint also gives more fine-grained information as to where the time is being spent.
If the Sync Duration is high then this indicates something is happening during the snapshotting.
During this stage snapshotState() is called for classes that implement the snapshotState interface;
this can be user code so thread-dumps can be useful for investigating this.
A long Async Duration would suggest that a lot of time is being spent on uploading the state to Amazon S3. This
can occur if the state is large or if there is a lot of state files that are being uploaded.
If this is the case it is worth investigating how state is being used by the application and ensuring that the Flink
native data structures are being used where possible (Using Keyed State

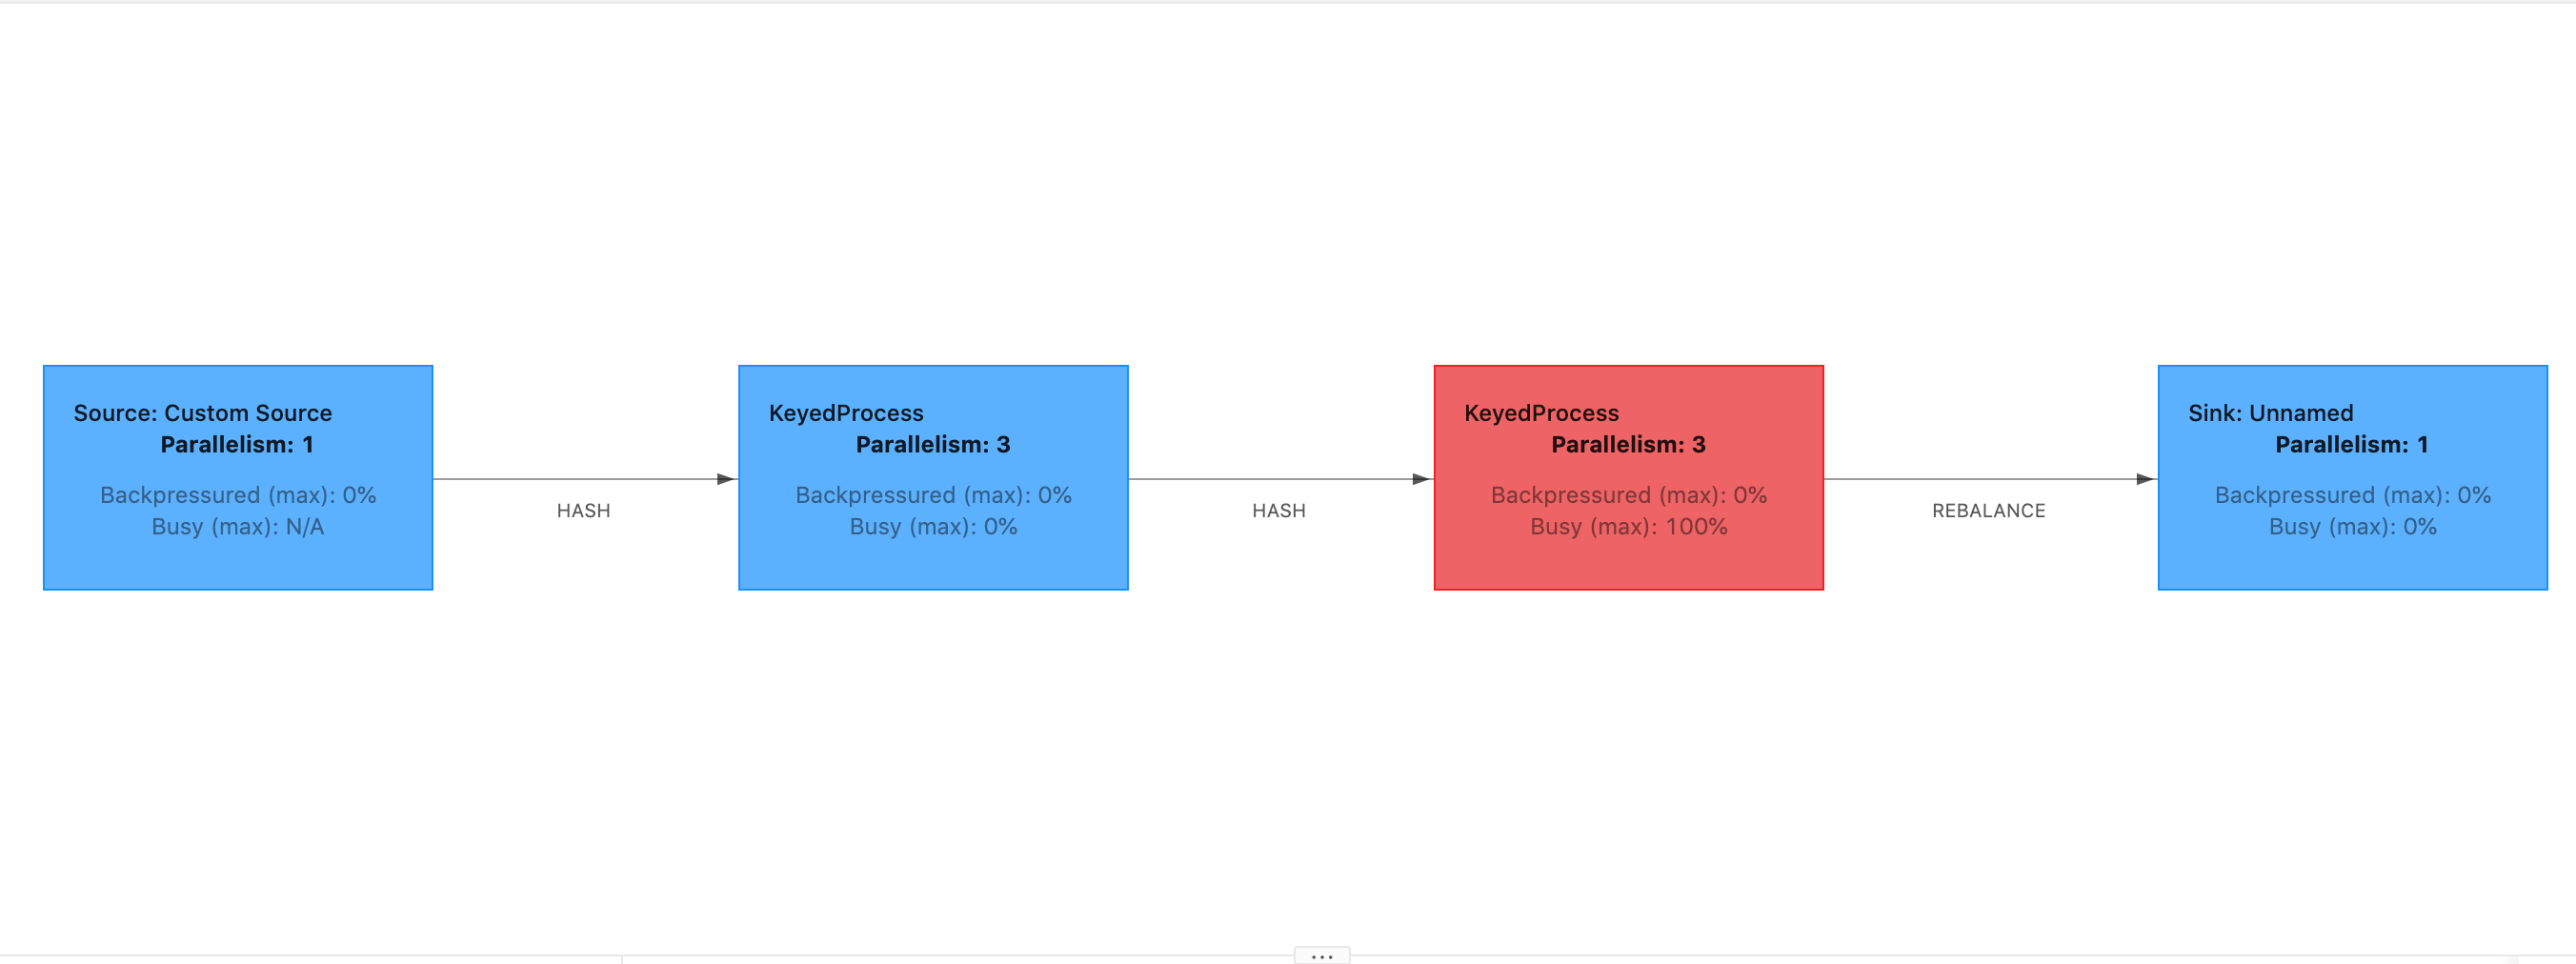
The Start Delay being high would show that the majority of the time is being spent on waiting for the checkpoint barrier to reach the operator. This indicates that the application is taking a while to process records, meaning the barrier is flowing through the job graph slowly. This is usually the case if the Job is backpressured or if an operator(s) is constantly busy. Following is an example of a JobGraph where the second KeyedProcess operator is busy.

You can investigate what is taking so long by either using Flink Flame Graphs or TaskManager thread dumps. Once the bottle-neck has been identified, it can be investigated further using either Flame-graphs or thread-dumps.
Thread dumps
Thread dumps are another debugging tool that is at a slightly lower level than flame graphs. A thread dump outputs the execution state of all threads at a point in time. Flink takes a JVM thread dump, which is an execution state of all threads within the Flink process. The state of a thread is presented by a stack trace of the thread as well as some additional information. Flame graphs are actually built using multiple stack traces taken in quick succession. The graph is a visualisation made from these traces that makes it easy to identify the common code paths.
"KeyedProcess (1/3)#0" prio=5 Id=1423 RUNNABLE
    at app//scala.collection.immutable.Range.foreach$mVc$sp(Range.scala:154)
    at $line33.$read$$iw$$iw$ExpensiveFunction.processElement(<console>>19)
    at $line33.$read$$iw$$iw$ExpensiveFunction.processElement(<console>:14)
    at app//org.apache.flink.streaming.api.operators.KeyedProcessOperator.processElement(KeyedProcessOperator.java:83)
    at app//org.apache.flink.streaming.runtime.tasks.OneInputStreamTask$StreamTaskNetworkOutput.emitRecord(OneInputStreamTask.java:205)
    at app//org.apache.flink.streaming.runtime.io.AbstractStreamTaskNetworkInput.processElement(AbstractStreamTaskNetworkInput.java:134)
    at app//org.apache.flink.streaming.runtime.io.AbstractStreamTaskNetworkInput.emitNext(AbstractStreamTaskNetworkInput.java:105)
    at app//org.apache.flink.streaming.runtime.io.StreamOneInputProcessor.processInput(StreamOneInputProcessor.java:66)
    ...
Above is a snippet of a thread dump taken from the Flink UI for a single thread. The first line contains some general information about this thread including:
The thread name KeyedProcess (1/3)#0
Priority of the thread prio=5
A unique thread Id Id=1423
Thread state RUNNABLE
The name of a thread usually gives information as to the general purpose of the thread. Operator threads can be identified by their name since operator threads have the same name as the operator, as well as an indication of which subtask it is related to, e.g., the KeyedProcess (1/3)#0 thread is from the KeyedProcess operator and is from the 1st (out of 3) subtask.
Threads can be in one of a few states:
NEW – The thread has been created but has not yet been processed
RUNNABLE – The thread is execution on the CPU
BLOCKED – The thread is waiting for another thread to release it’s lock
WAITING – The thread is waiting by using a
wait(),join(), orpark()methodTIMED_WAITING – The thread is waiting by using a sleep, wait, join or park method, but with a maximum wait time.
Note
In Flink 1.13, the maximum depth of a single stacktrace in the thread dump is limited to 8.
Note
Thread dumps should be the last resort for debugging performance issues in a Flink application as they can be challenging to read, require multiple samples to be taken and manually analysed. If at all possible it is preferable to use flame graphs.
Thread dumps in Flink
In Flink, a thread dump can be taken by choosing the Task Managers option on the left navigation bar of the Flink UI, selecting a specific task manager, and then navigating to the Thread Dump tab. The thread dump can be downloaded, copied to your favorite text editor (or thread dump analyzer), or analyzed directly inside the text view in the Flink Web UI (however, this last option can be a bit clunky.
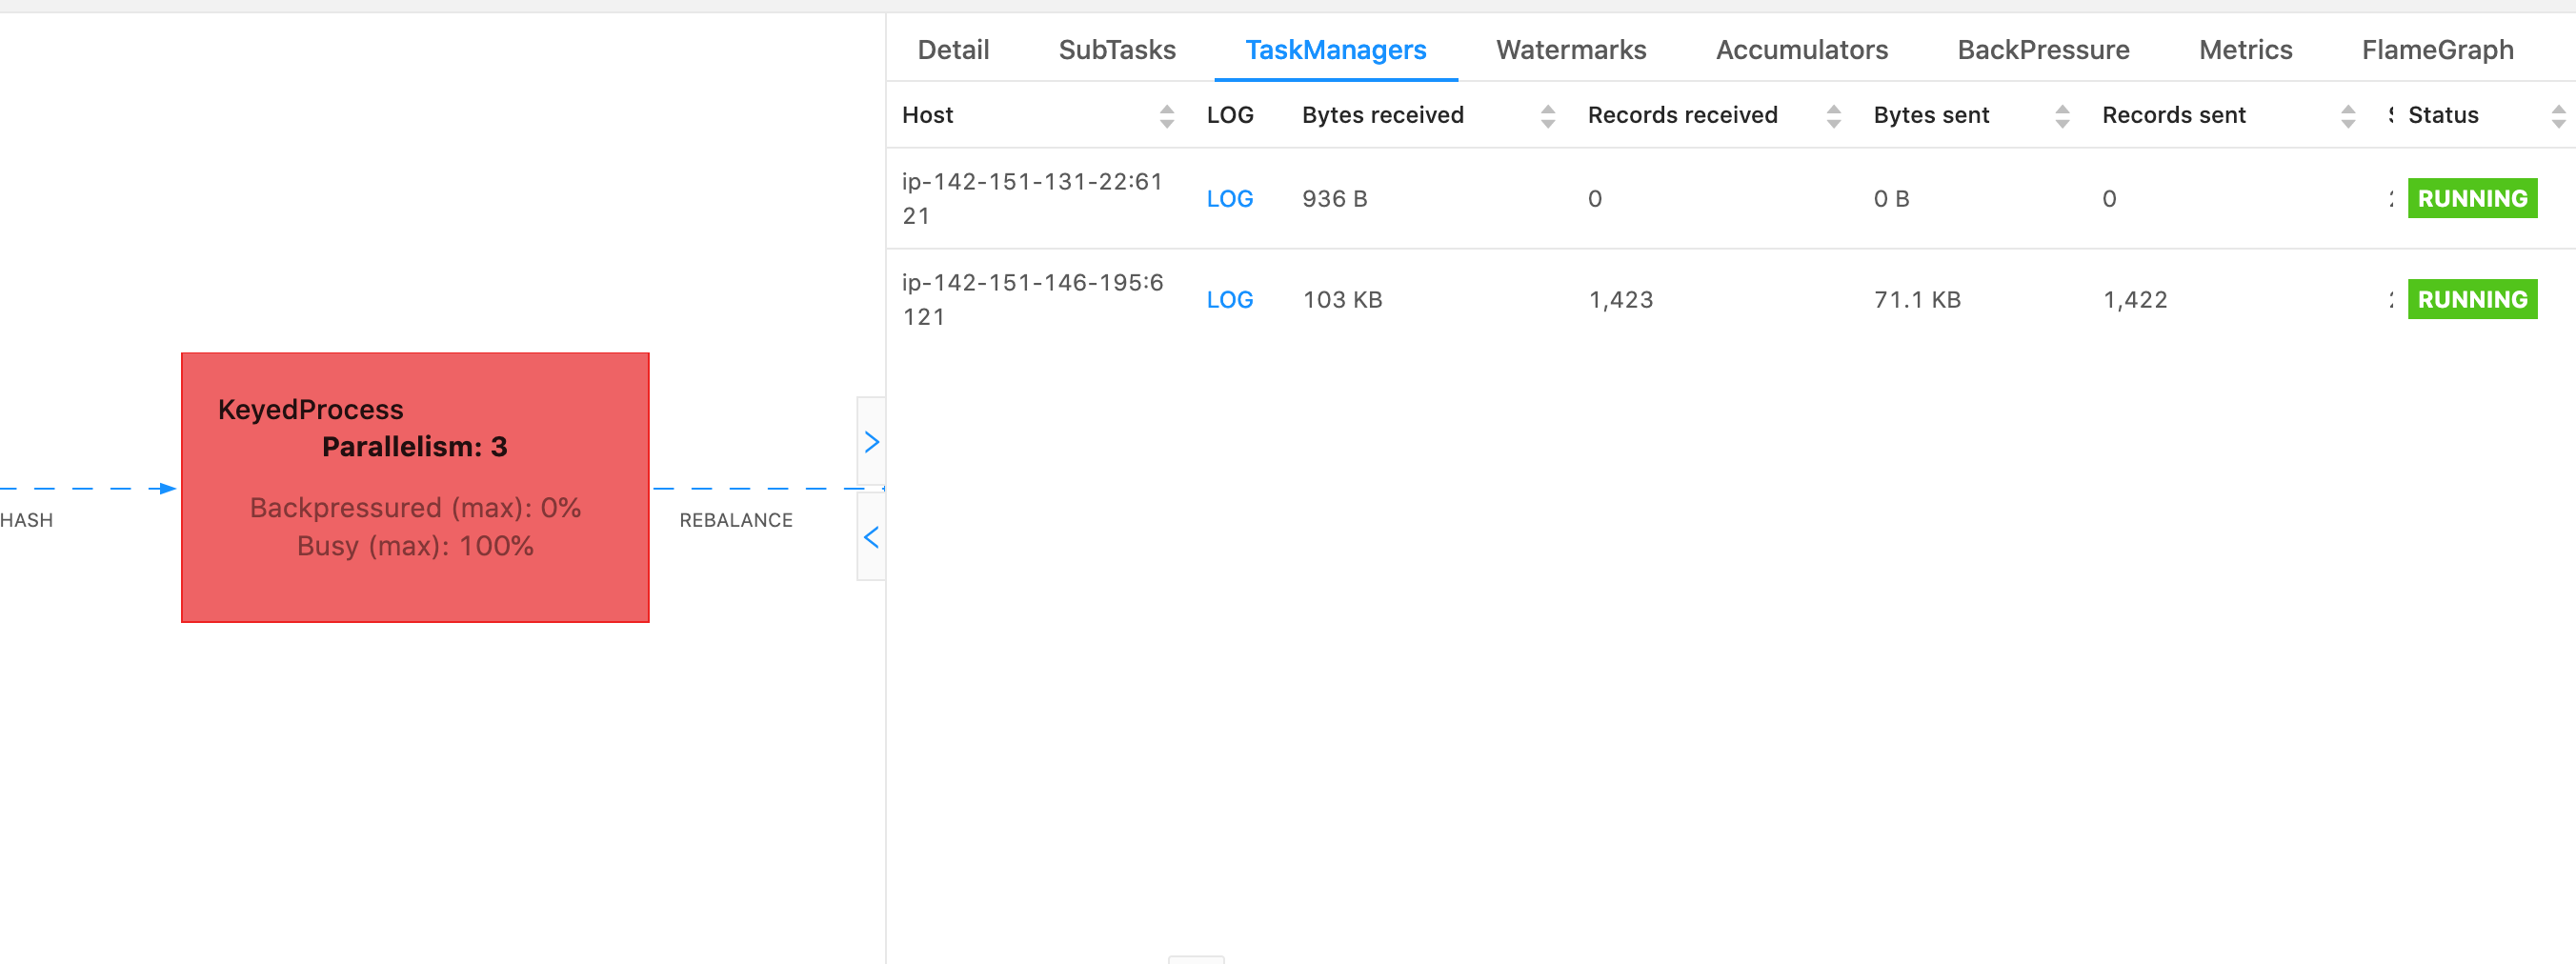
To determine which Task Manager to take a thread dump of the TaskManagers tab can be used when a particular operator is chosen. This shows that the operator is running on different subtasks of an operator and can run on different Task Managers.

The dump will be comprised of multiple stack traces. However when investigating the dump the ones related to an operator are the most important. These can easily be found since operator threads have the same name as the operator, as well as an indication of which subtask it is related to. For example the following stack trace is from the KeyedProcess operator and is the first subtask.
"KeyedProcess (1/3)#0" prio=5 Id=595 RUNNABLE
    at app//scala.collection.immutable.Range.foreach$mVc$sp(Range.scala:155)
    at $line360.$read$$iw$$iw$ExpensiveFunction.processElement(<console>:19)
    at $line360.$read$$iw$$iw$ExpensiveFunction.processElement(<console>:14)
    at app//org.apache.flink.streaming.api.operators.KeyedProcessOperator.processElement(KeyedProcessOperator.java:83)
    at app//org.apache.flink.streaming.runtime.tasks.OneInputStreamTask$StreamTaskNetworkOutput.emitRecord(OneInputStreamTask.java:205)
    at app//org.apache.flink.streaming.runtime.io.AbstractStreamTaskNetworkInput.processElement(AbstractStreamTaskNetworkInput.java:134)
    at app//org.apache.flink.streaming.runtime.io.AbstractStreamTaskNetworkInput.emitNext(AbstractStreamTaskNetworkInput.java:105)
    at app//org.apache.flink.streaming.runtime.io.StreamOneInputProcessor.processInput(StreamOneInputProcessor.java:66)
    ...
This can become confusing if there are multiple operators with the same name but we can name operators to get around this. For example:
....
.process(new ExpensiveFunction).name("Expensive function")
Flame graphs
Flame graphs are a useful debugging tool that visualize the stack traces of the targeted code, which allows the most frequent code paths to be identified.
They are created by sampling stack traces a number of times. The x-axis of a flame graph shows the different stack profiles, while
the y-axis shows the stack depth, and calls in the stack trace. A single rectangle in a flame graph represents on stack frame,
and the width of a frame shows how frequently it appears in the stacks. For more details about flame graphs and how to use them,
see Flame Graphs
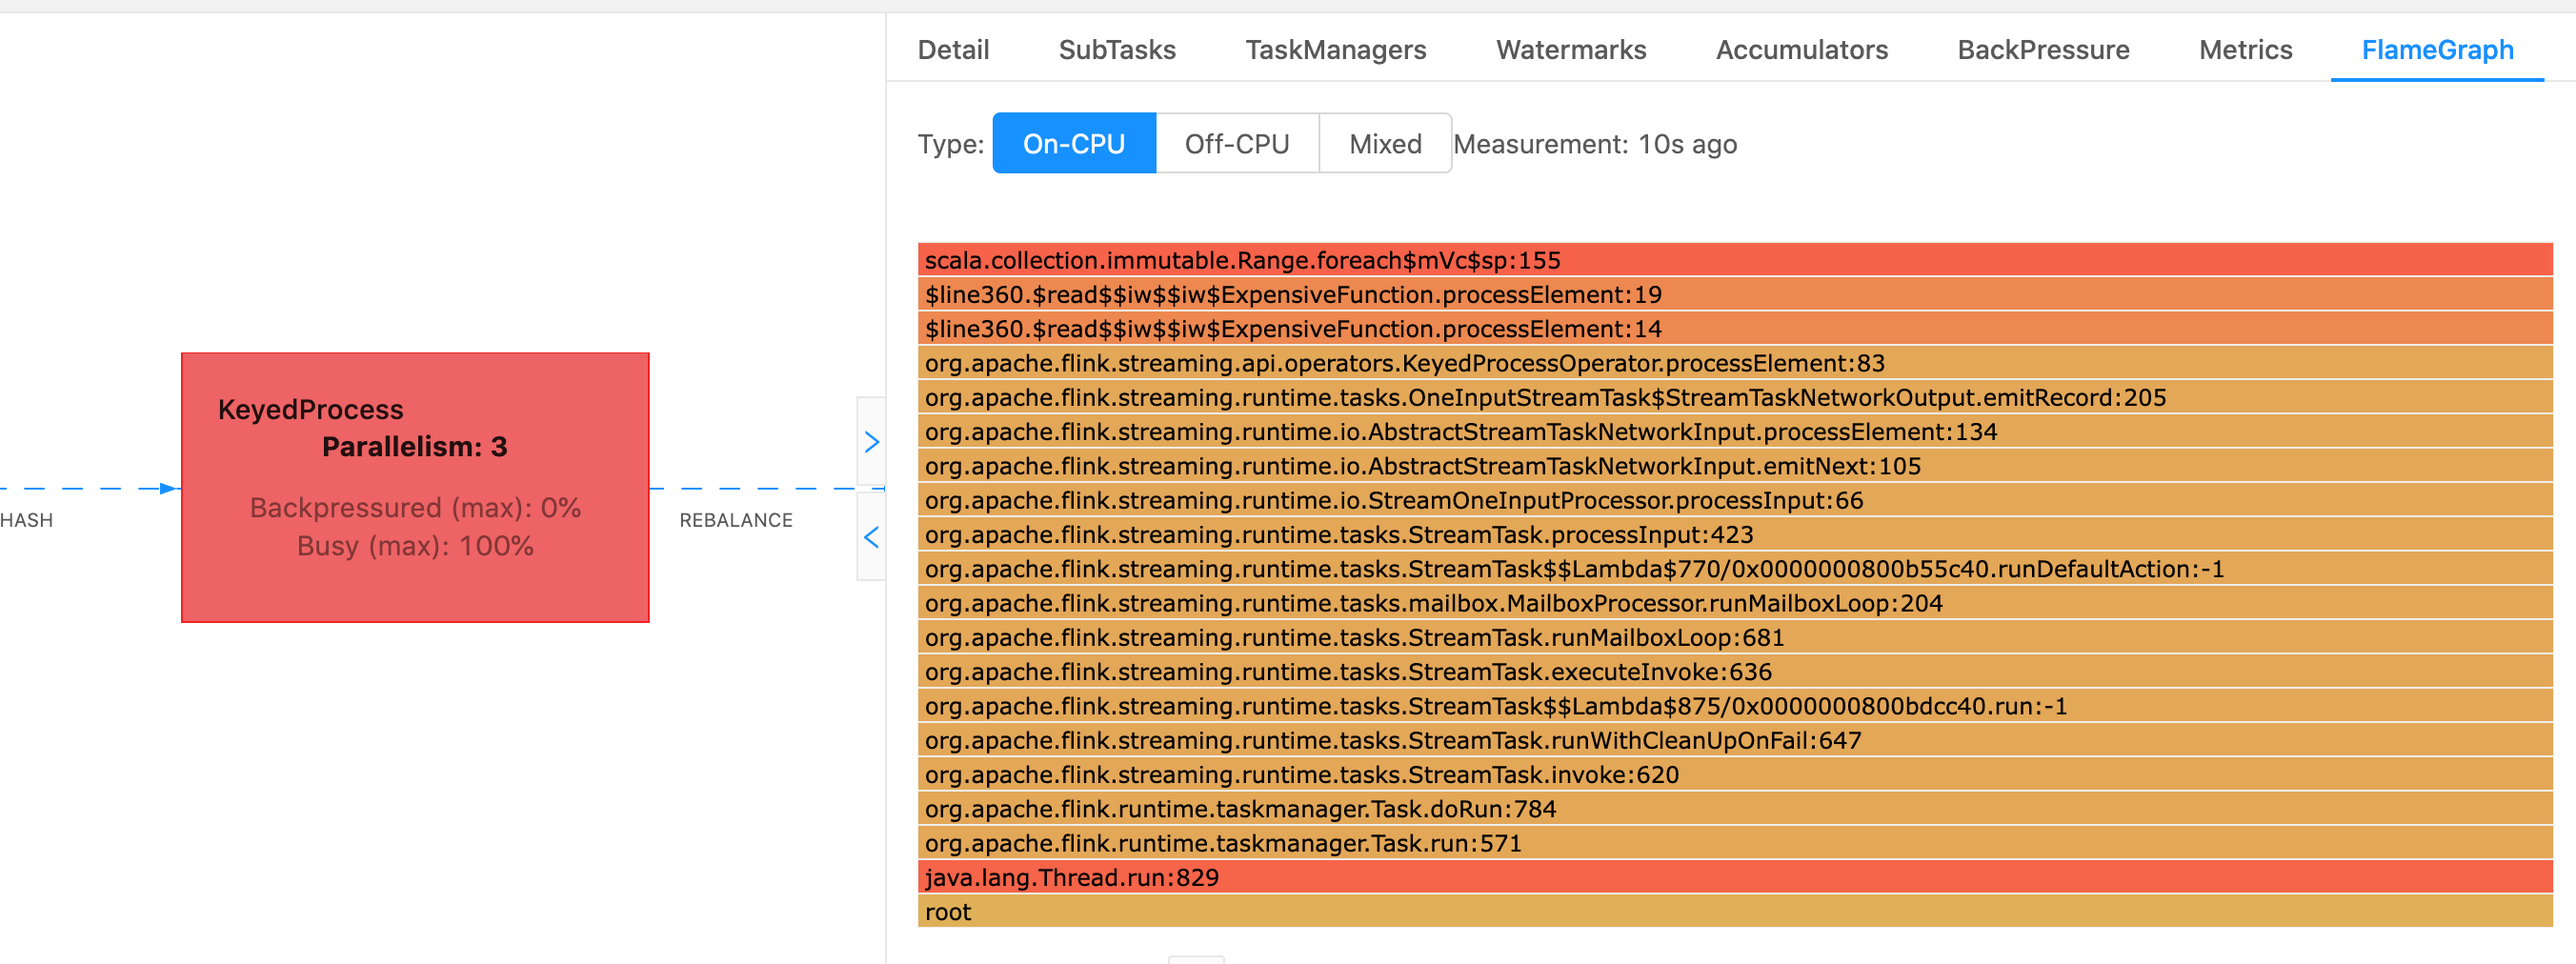
In Flink, the flame graph for an operator can be accessed via the Web UI by selecting an operator and then choosing the FlameGraph tab. Once enough samples have been collected the flamegraph will be displayed. Following is the FlameGraph for the ProcessFunction that was taking a lot of time to checkpoint.

This is a very simple flame graph and shows that all the CPU time is being spent within a foreach look within the processElement of the ExpensiveFunction operator. You also get the line number to help determine where
in the code execution is taking place.