Neptune CloudWatch Metrics
Note
Amazon Neptune sends metrics to CloudWatch only when they have a non-zero value.
For all Neptune metrics, the aggregation granularity is 5 minutes.
Neptune CloudWatch metrics
The following table lists the CloudWatch metrics that Neptune supports.
Note
All cumulative metrics are reset to zero whenever the server restarts, whether for maintenance, a reboot, or recovering from a crash.
| Metric | Description | Time Interval | Instance Statistic |
|---|---|---|---|
|
The total amount of backup storage, in bytes, used to support
from the Neptune DB cluster's backup retention window. Included in the
total reported by the |
||
|
The percentage of requests that are served by the buffer cache. This metric can be useful in diagnosing query latency, because cache misses induce significant latency. If the cache hit ratio is below 99.9, consider upgrading the instance type to cache more data in memory. |
1 minute |
average |
|
For a read replica, the amount of lag when replicating updates from the primary instance, in milliseconds. |
1 minute |
average |
|
The maximum amount of lag between the primary instance and each Neptune DB instance in the DB cluster, in milliseconds. |
1 minute |
max/min |
|
The minimum amount of lag between the primary instance and each Neptune DB instance in the DB cluster, in milliseconds. |
1 minute |
max/min |
|
The number of CPU credits that an instance has accumulated, reported at 5-minute intervals. You can use this metric to determine how long a DB instance can burst beyond its baseline performance level at a given rate. |
5 min |
average |
|
The number of CPU credits consumed during the specified period, reported at 5-minute intervals. This metric measures the amount of time during which physical CPUs have been used for processing instructions by virtual CPUs allocated to the DB instance. |
5 min |
average |
|
The number of surplus credits that have been spent by an unlimited instance when its
|
5 min |
average |
|
The number of spent surplus credits that are not paid down by earned CPU credits, and incur an additional charge. |
5 min |
average |
|
The percentage of CPU utilization. |
1 minute |
average/P99 |
|
The amount of time that the instance has been running, in seconds. |
1 min |
average |
|
The amount of available random access memory, in bytes. |
1 min |
average |
|
The number of bytes of redo log data transferred from the primary Amazon Web Services Region to a secondary Amazon Web Services Region in a Neptune global database. |
1 min |
average |
|
The number of write I/O operations replicated from the primary Amazon Web Services Region in the global database to the cluster volume in a secondary Amazon Web Services Region. The billing calculations for each DB cluster in a Neptune global database
use the |
5 min |
sum |
|
The number of milliseconds that a secondary cluster is behind the primary cluster for both user transactions and system transactions. |
1 min |
average |
|
Number of client-side errors per second in Gremlin traversals. |
1 min |
average |
|
Number of server-side errors per second in Gremlin traversals. |
1 min |
average |
|
Number of requests per second to the Gremlin engine. |
1 min |
average |
|
The number of open WebSocket connections to Neptune. |
1 min |
sum |
|
Number of client-side errors per second from loader requests. |
1 min |
average |
|
Number of loader requests per second. |
1 min |
average |
|
Number of loader server-side errors per second. |
1 min |
average |
|
The number of requests waiting in the input queue pending execution. Neptune starts throttling requests when they exceed the maximum queue capacity. |
1 min |
sum |
|
Only applicable to a Neptune Serverless DB instance or DB cluster. At an instance level, reports a percentage calculated as the number of Neptune capacity units (NCUs) currently being used by the instance in question, divided by the maximum NCU capacity setting for the cluster. An NCU, or Neptune capacity unit, consists of 2 GiB (gibibyte) of memory (RAM), along with associated virtual processor capacity (vCPU) and networking. At a cluster level, |
||
|
The amount of incoming network throughput received from clients by each instance in the Neptune DB cluster, in bytes per second. This throughput does not include network traffic between instances in the DB cluster and the cluster volume. |
1 min |
average |
|
The amount of network throughput both received from and transmitted to clients by each instance in the Neptune DB cluster, in bytes per second. This throughput does not include network traffic between instances in the DB cluster and the cluster volume. |
1 min |
average |
|
The amount of outgoing network throughput transmitted to clients by each instance in the Neptune DB cluster, in bytes per second. This throughput does not include network traffic between instances in the DB cluster and the cluster volume. |
1 min |
average |
NumIndexDeletesPerSec |
Number of deletes from individual indexes. Deletes from each index are counted individually. This includes the deletes that may get rolled back if a query encounters an error. | 1 min |
average |
NumIndexInsertsPerSec |
Number of inserts to individual indexes. Inserts to each index are counted separately. This includes the inserts that may get rolled back if a query encounters an error. | 1 min |
average |
NumIndexReadsPerSec |
Number of statements scanned from any index. Any access pattern starts with a search on an index and reads of all matching statements. An increase in this metric can cause an increase in query latencies or CPU utilization. | 1 min |
average |
|
The number of requests queued per second. |
||
|
Number of Gremlin result cache hits. |
1 min |
sum |
|
Number of Gremlin result cache misses. |
1 min |
sum |
|
The number of transactions successfully committed per second. |
1 min |
sum |
|
The number of transactions opened on the server per second. |
1 min |
sum |
|
For write queries, the number of transactions per second rolled back on the server because of errors. For read-only queries, this metric is equal to the number of completed read-only transactions per second. |
1 min |
sum |
NumUndoPagesPurged |
This metric indicates the number of batches purged. This metric is indicator of progress in
purging. The value is 0 for reader instances, and the metric only applies to
the writer instance.
|
1 min |
sum |
|
Number of requests per second (both HTTPS and Bolt) to the openCypher engine. |
1 min |
average |
|
The number of open Bolt connections to Neptune. |
1 min |
sum |
|
Total estimated size (in bytes) of all cached items in the Gremlin result cache. |
1 min |
sum |
|
Number of items in the Gremlin result cache. |
1 min |
sum |
|
The timestamp of the oldest item cached in the Gremlin result cache. |
1 min |
sum |
|
The timestamp of the newest item cached in the Gremlin result cache. |
||
|
As an instance-level metric, At a cluster-level, |
||
|
The total amount of backup storage consumed by all snapshots
for a Neptune DB cluster outside its backup retention window, in bytes.
Included in the total reported by the |
1 min |
sum |
|
The number of client-side errors per second in SPARQL queries. |
1 min |
average |
|
The number of requests per second to the SPARQL engine. |
1 min |
average |
|
The number of SPARQL server errors per second. |
1 min |
average |
|
The total number of statements scanned for DFE statistics since the server started. Every time statistics computation is triggered, this number increases, but when no computation is happening, it remains static. As a result, if you graph it over time, you can tell when computation happened and when it didn't: 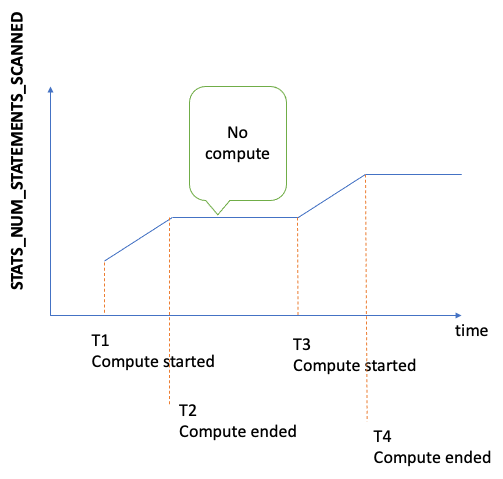
By looking at the slope of the graph in periods where the metric is increasing, you can also tell how quickly the computation was going. If there is no such metric, it means that the statistics feature is disabled on your DB cluster, or that the engine version you're running doesn't have the statistics feature. If the metric value is zero, it means that no statistics computation has occurred. |
1 min |
sum |
|
The amount of network throughput received from the storage subsystem by each instance in the Neptune DB cluster. |
1 min |
average |
StorageNetworkThroughput |
The amount of network throughput received from and sent to the storage subsystem by each instance in the Neptune DB cluster. | 1 min |
average |
|
The amount of network throughput sent to the storage subsystem by each instance in the Neptune DB cluster. |
1 min |
average |
|
The amount of swap space used. |
1 min |
sum |
|
The number of IOPS for both read and writes on local storage attached to the Neptune DB instance. This metric represents a count and is measured once per second. |
||
|
The amount of data transferred to and from local storage associated with the Neptune DB instance. This metric represents bytes and is measured once per second. |
||
|
The total amount of backup storage for which you are billed for a
given Neptune DB cluster, in bytes. Includes the backup storage measured by
the |
1 day |
sum |
|
The total number of requests per second to the server from all sources. |
1 min |
average |
|
The total number per second of requests that errored out because of client-side issues. |
1 min |
average |
|
The total number per second of requests that errored out on the server because of internal failures. |
1 min |
average |
|
The count of undo logs in the undo log list. Undo logs contain records of committed transactions that expire when all active transactions are more recent than the commit time. The expired records are periodically purged. Records for delete operations can take longer to purge than records for other types of transaction. Purging is done exclusively by the DB cluster's writer instance, so the
rate of purging is dependent on the writer instance type. If the
Also, if you are upgrading to engine version |
1 min |
sum |
|
The remaining available space for the cluster volume, in bytes. As the cluster volume grows, this value decreases. If it reaches zero, the cluster reports an out-of-space error. If you want to detect whether your Neptune DB cluster is approaching
it's size limit, this value is simpler and more reliable
to monitor than This metric is reported only by the writer instance. To avoid disruption during
failovers, use the cluster-level dimension ( |
1 min |
average |
|
The total amount of storage allocated to your Neptune DB cluster, in bytes. This is the amount of storage for which you are billed. It is the maximum amount of storage allocated to your DB cluster at any point in its existence, not the amount you are currently using (see Neptune storage billing). |
5 min |
sum |
|
The total number of billed read I/O operations from a cluster volume, reported a 5-minute intervals. Billed read operations are calculated at the cluster volume level, aggregated from all instances in the Neptune DB cluster, and then reported at 5-minute intervals. |
5 min |
sum |
VolumeWriteIOPs |
The total number of write disk I/O operations to the cluster volume, reported at 5-minute intervals. |
5 min |
sum |
CloudWatch Metrics That Are Now Deprecated in Neptune
Use of these Neptune metrics has now been deprecated. They are still supported, but may be eliminated in the future as new and better metrics become available.
Metric |
Description |
|---|---|
|
Number of HTTP 1xx responses for the Gremlin endpoint per second. We recommend that you use the new |
|
Number of HTTP 2xx responses for the Gremlin endpoint per second. |
|
Number of HTTP 4xx errors for the Gremlin endpoint per second. We recommend that you use the new |
|
Number of HTTP 5xx errors for the Gremlin endpoint per second. We recommend that you use the new |
|
Number of errors in Gremlin traversals. |
|
Number of requests to Gremlin engine. |
|
Number of successful WebSocket connections to the Gremlin endpoint per second. |
|
Number of WebSocket client errors on the Gremlin endpoint per second. |
|
Number of WebSocket server errors on the Gremlin endpoint per second. |
|
Number of potential WebSocket connections currently available. |
|
Number of HTTP 100 responses for the endpoint per second. We recommend that you use the new |
|
Number of HTTP 101 responses for the endpoint per second. We recommend that you use the new |
|
Number of HTTP 1xx responses for the endpoint per second. |
|
Number of HTTP 200 responses for the endpoint per second. |
|
Number of HTTP 2xx responses for the endpoint per second. |
|
Number of HTTP 400 errors for the endpoint per second. We recommend that you use the new |
|
Number of HTTP 403 errors for the endpoint per second. We recommend that you use the new |
|
Number of HTTP 405 errors for the endpoint per second. We recommend that you use the new |
|
Number of HTTP 413 errors for the endpoint per second. We recommend that you use the new |
|
Number of HTTP 429 errors for the endpoint per second. We recommend that you use the new |
|
Number of HTTP 4xx errors for the endpoint per second. |
|
Number of HTTP 500 errors for the endpoint per second. We recommend that you use the new |
|
Number of HTTP 501 errors for the endpoint per second. We recommend that you use the new |
|
Number of HTTP 5xx errors for the endpoint per second. |
|
Number of errors from Loader requests. |
|
Number of Loader Requests. |
|
Number of HTTP 1xx responses for the SPARQL endpoint per second. We recommend that you use the new |
|
Number of HTTP 2xx responses for the SPARQL endpoint per second. |
|
Number of HTTP 4xx errors for the SPARQL endpoint per second. We recommend that you use the new |
|
Number of HTTP 5xx errors for the SPARQL endpoint per second. We recommend that you use the new |
|
Number of errors in the SPARQL queries. |
|
Number of requests to the SPARQL engine. |
|
Number of errors from the status endpoint. |
|
Number of requests to the status endpoint. |