Amazon Redshift will no longer support the use of Python UDFs after June 30, 2026.
We will start enforcing it in phases. For more information on the details of Python end of life
and migration options, see the
blog post
Viewing workload concurrency and concurrency scaling data
By using concurrency scaling metrics in Amazon Redshift, you can do the following:
-
Analyze whether you can reduce the number of queued queries by enabling concurrency scaling. You can compare by WLM queue or for all WLM queues.
-
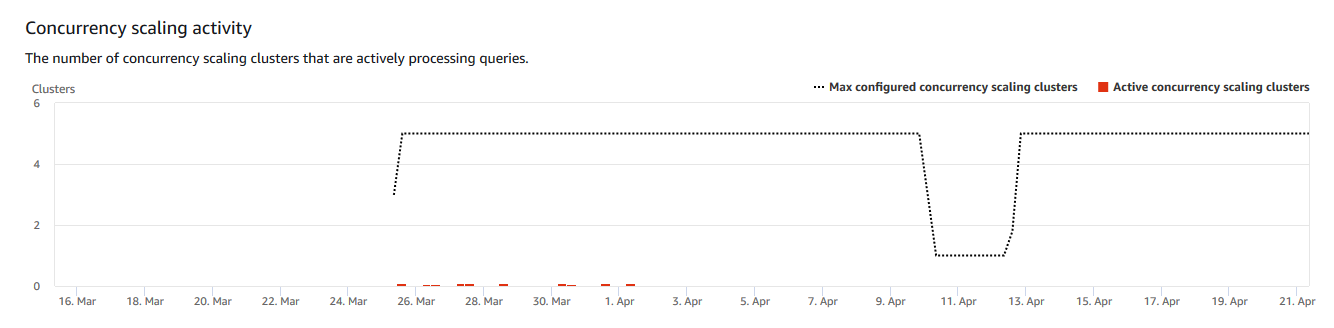
View concurrency scaling activity in concurrency scaling clusters. This can tell you if concurrency scaling is limited by the
max_concurrency_scaling_clusters. If so, you can choose to increase themax_concurrency_scaling_clustersin the DB parameter. -
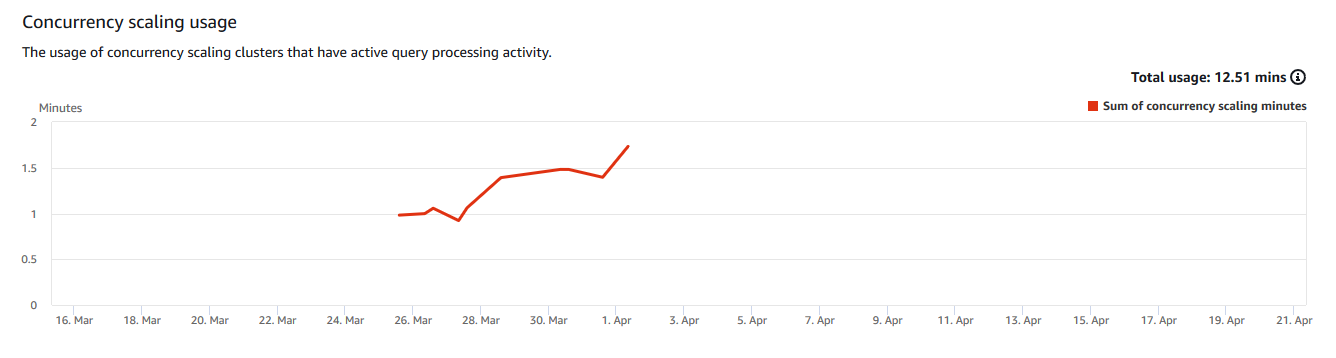
View the total usage of concurrency scaling summed across all concurrency scaling clusters.
To display concurrency scaling data
-
Sign in to the Amazon Web Services Management Console and open the Amazon Redshift console at https://console.amazonaws.cn/redshiftv2/
. -
On the navigation menu, choose Clusters, then choose the cluster name from the list to open its details. The details of the cluster are displayed, which can include Cluster performance, Query monitoring, Databases, Datashares, Schedules, Maintenance, and Properties tabs.
-
Choose the Query monitoring tab for metrics about your queries.
-
In the Query monitoring section, choose Workload concurrency tab.
The tab includes the following graphs:
-
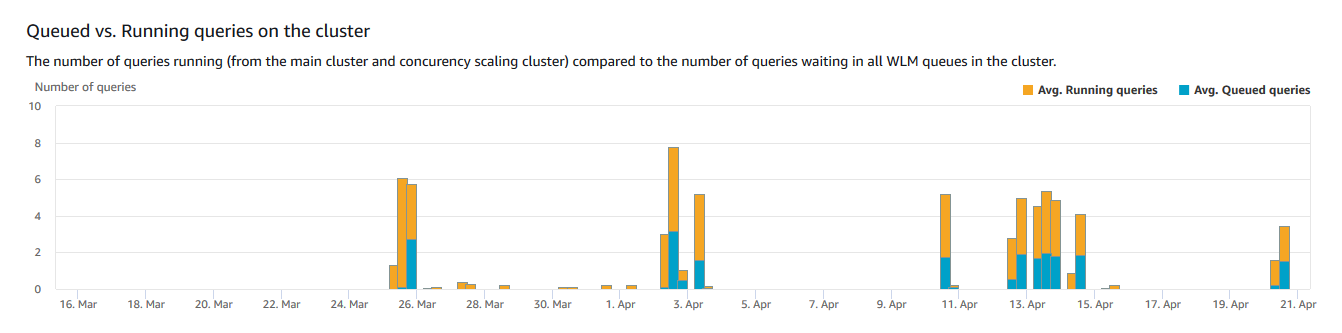
Queued vs. Running queries on the cluster – The number of queries running (from the main cluster and concurrency scaling cluster) compared to the number of queries waiting in all WLM queues in the cluster.
-
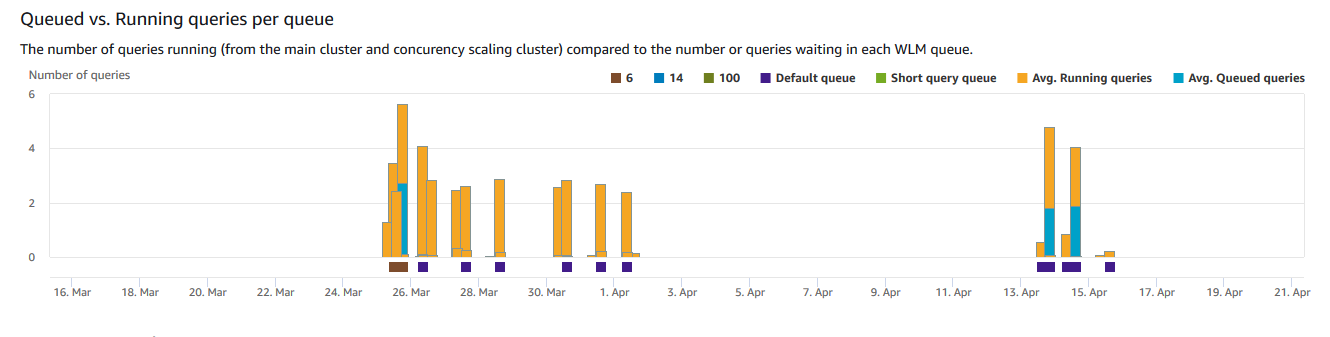
Queued vs. Running queries per queue – The number of queries running (from the main cluster and concurrency scaling cluster) compared to the number or queries waiting in each WLM queue.
-
Concurrency scaling activity – The number of concurrency scaling clusters that are actively processing queries.
-
Concurrency scaling usage – The usage of concurrency scaling clusters that have active query processing activity.
-
Workload concurrency graphs
The following examples show graphs that are displayed in the new Amazon Redshift console. To create similar graphs in Amazon CloudWatch, you can use the concurrency scaling and WLM CloudWatch metrics. For more information about CloudWatch metrics for Amazon Redshift, see Performance data in Amazon Redshift.
-
Queued vs. Running queries on the cluster
-
Queued vs. Running queries per queue
-
Concurrency scaling activity
-
Concurrency scaling usage