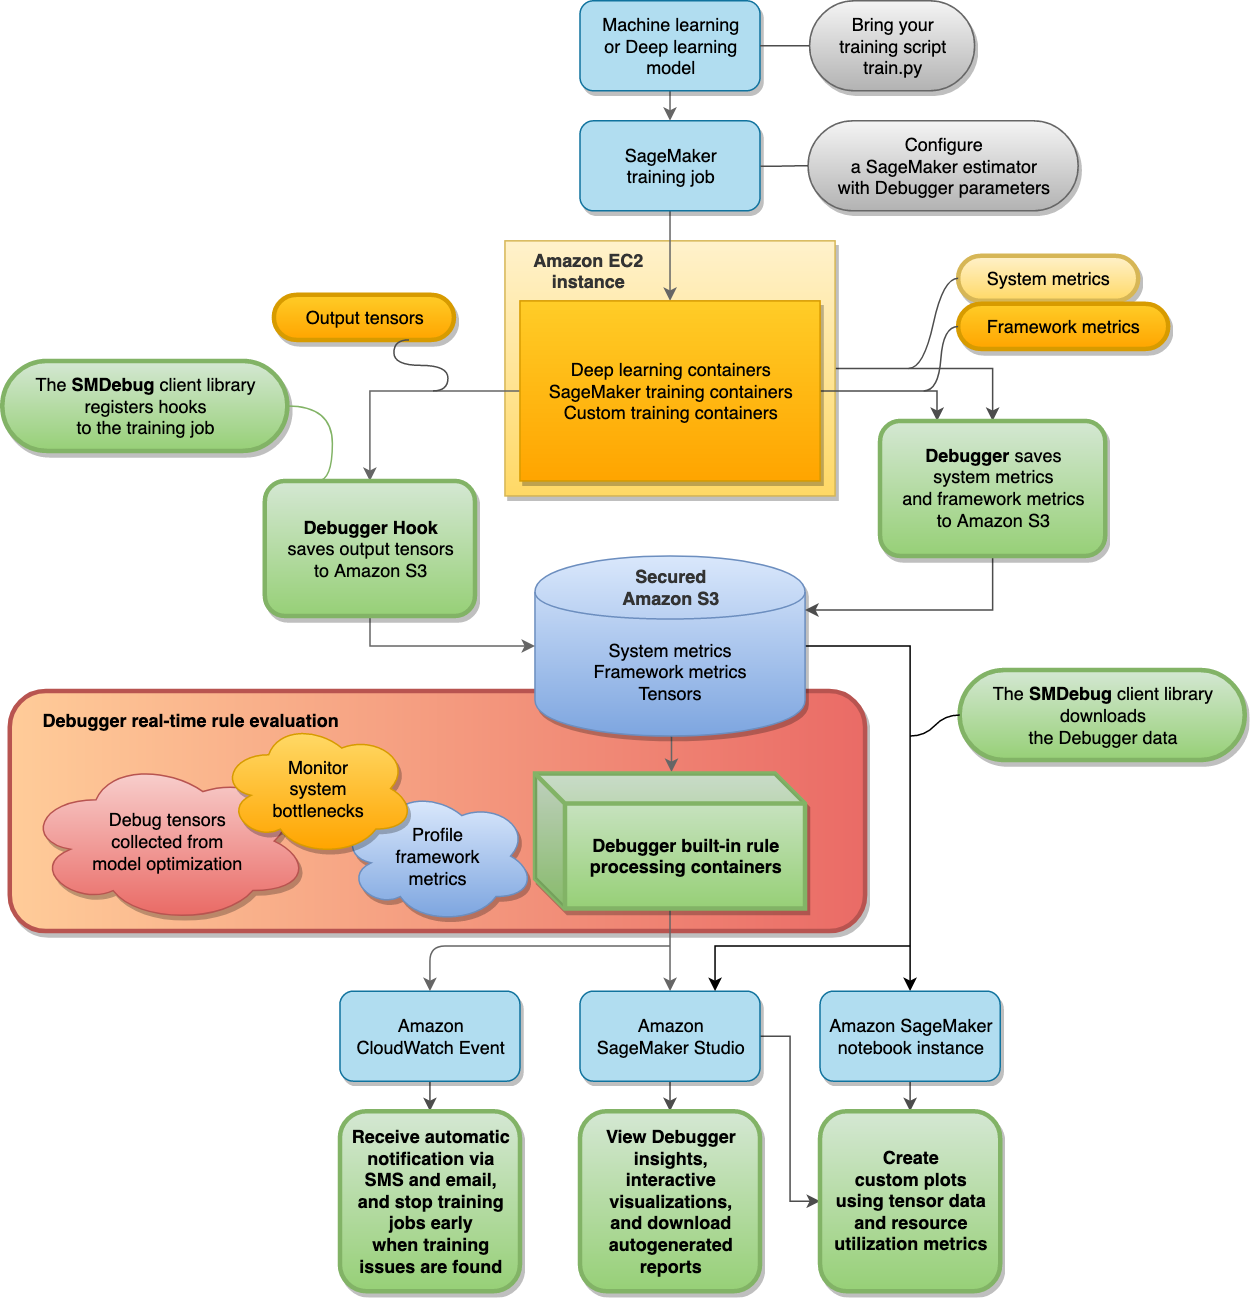
Amazon SageMaker Debugger architecture
This topic walks you through a high-level overview of the Amazon SageMaker Debugger workflow.
Debugger supports profiling functionality for performance optimization to identify computation issues, such as system bottlenecks and underutilization, and to help optimize hardware resource utilization at scale.
Debugger's debugging functionality for model optimization is about analyzing non-converging training issues that can arise while minimizing the loss functions using optimization algorithms, such as gradient descent and its variations.
The following diagram shows the architecture of SageMaker Debugger. The blocks with bold boundary lines are what Debugger manages to analyze your training job.

Debugger stores the following data from your training jobs in your secured Amazon S3 bucket:
-
Output tensors – Collections of scalars and model parameters that are continuously updated during the forward and backward passes while training ML models. The output tensors include scalar values (accuracy and loss) and matrices (weights, gradients, input layers, and output layers).
Note
By default, Debugger monitors and debugs SageMaker training jobs without any Debugger-specific parameters configured in SageMaker AI estimators. Debugger collects system metrics every 500 milliseconds and basic output tensors (scalar outputs such as loss and accuracy) every 500 steps. It also runs the
ProfilerReportrule to analyze the system metrics and aggregate the Studio Debugger insights dashboard and a profiling report. Debugger saves the output data in your secured Amazon S3 bucket.
The Debugger built-in rules run on processing containers, which are designed to evaluate machine learning models by processing the training data collected in your S3 bucket (see Process Data and Evaluate Models). The built-in rules are fully managed by Debugger. You can also create your own rules customized to your model to watch for any issues you want to monitor.