Explore the Amazon SageMaker Debugger Insights dashboard
When you initiate a SageMaker training job, SageMaker Debugger starts monitoring the resource utilization of the Amazon EC2 instances by default. You can track the system utilization rates, statistics overview, and built-in rule analysis through the Insights dashboard. This guide walks you through the content of the SageMaker Debugger Insights dashboard under the following tabs: System Metrics and Rules.
Note
The SageMaker Debugger Insights dashboard runs a Studio Classic application on an
ml.m5.4xlarge instance to process and render the visualizations.
Each SageMaker Debugger Insights tab runs one Studio Classic kernel session. Multiple kernel
sessions for multiple SageMaker Debugger Insights tabs run on the single instance. When you
close a SageMaker Debugger Insights tab, the corresponding kernel session is also closed. The
Studio Classic application remains active and accrues charges for the
ml.m5.4xlarge instance usage. For information about pricing, see
the Amazon SageMaker Pricing
Important
When you are done using the SageMaker Debugger Insights dashboard, shut down the
ml.m5.4xlarge instance to avoid accruing charges. For instructions
on how to shut down the instance, see Shut down the Amazon SageMaker Debugger Insights
instance.
Important
In the reports, plots and recommendations are provided for informational purposes and are not definitive. You are responsible for making your own independent assessment of the information.
Topics
System metrics
In the System Metrics tab, you can use the summary table and timeseries plots to understand resource utilization.
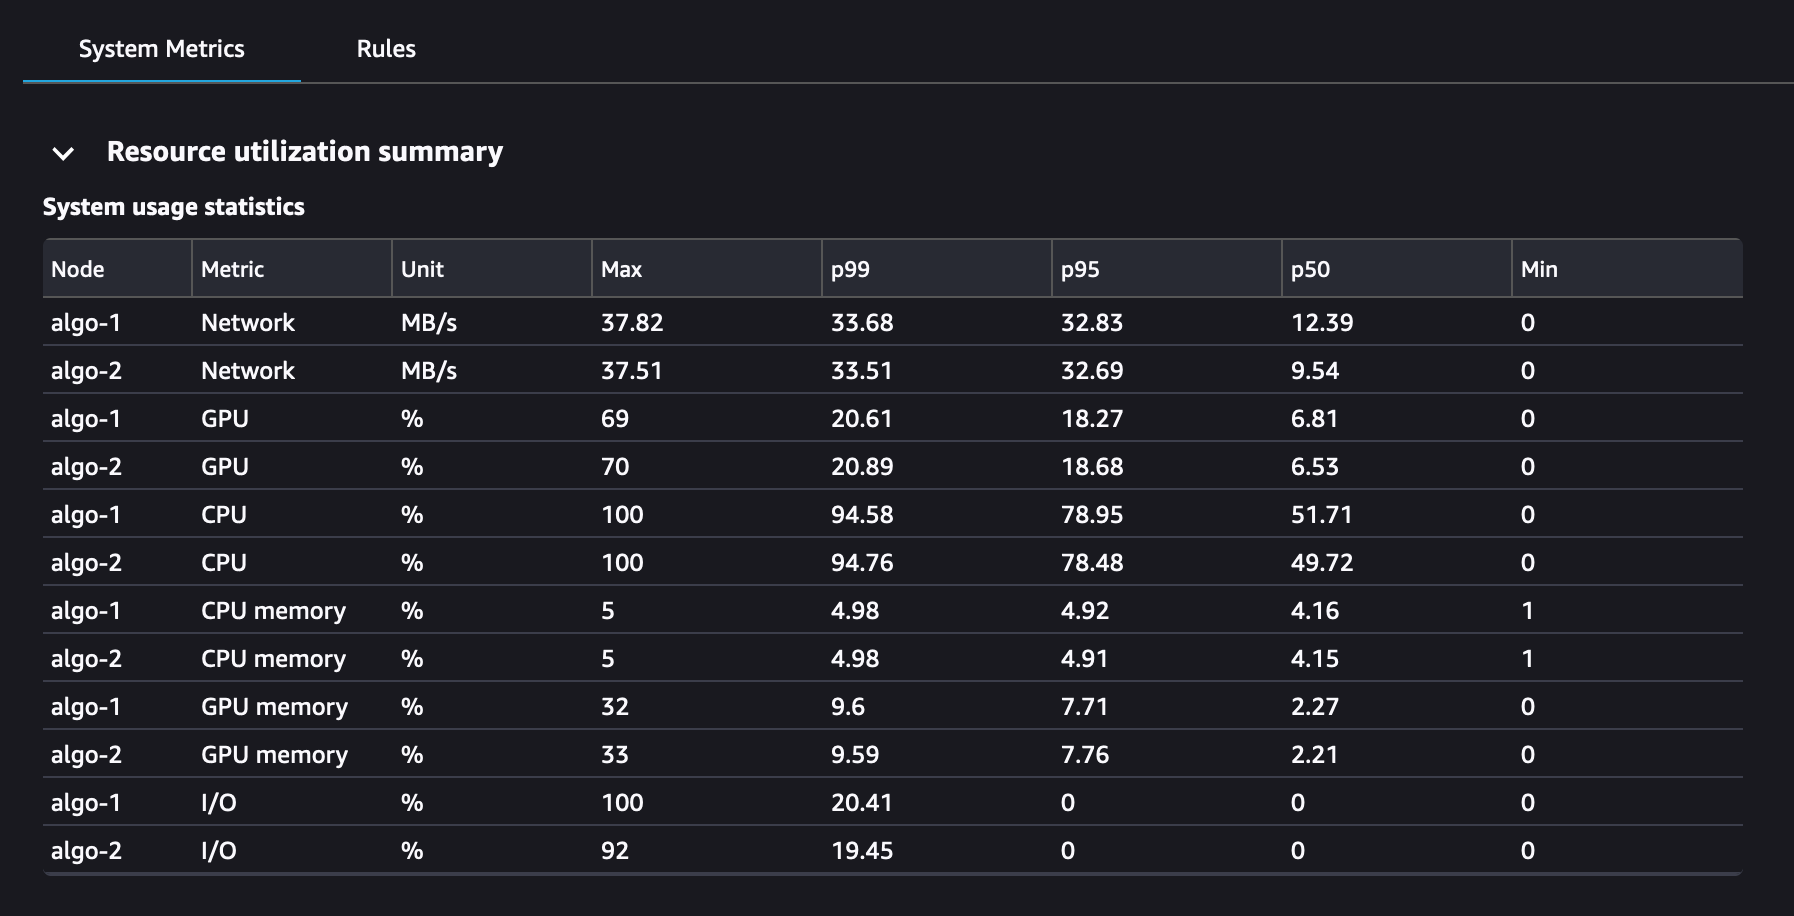
Resource utilization summary
This summary table shows the statistics of compute resource utilization metrics of all nodes (denoted as algo-n). The resource utilization metrics include the total CPU utilization, the total GPU utilization, the total CPU memory utilization, the total GPU memory utilization, the total I/O wait time, and the total network in bytes. The table shows the minimum and the maximum values, and p99, p90, and p50 percentiles.
Resource utilization time series plots
Use the time series graphs to see more details of resource utilization and identify at what time interval each instance shows any undesired utilization rate, such as low GPU utilization and CPU bottlenecks that can cause a waste of the expensive instance.
The time series graph controller UI
The following screenshot shows the UI controller for adjusting the time series graphs.

-
algo-1: Use this dropdown menu to choose the node that you want to look into.
-
Zoom In: Use this button to zoom in the time series graphs and view shorter time intervals.
-
Zoom Out: Use this button to zoom out the time series graphs and view wider time intervals.
-
Pan Left: Move the time series graphs to an earlier time interval.
-
Pan Right: Move the time series graphs to a later time interval.
-
Fix Timeframe: Use this check box to fix or bring back the time series graphs to show the whole view from the first data point to the last data point.
CPU utilization and I/O wait time
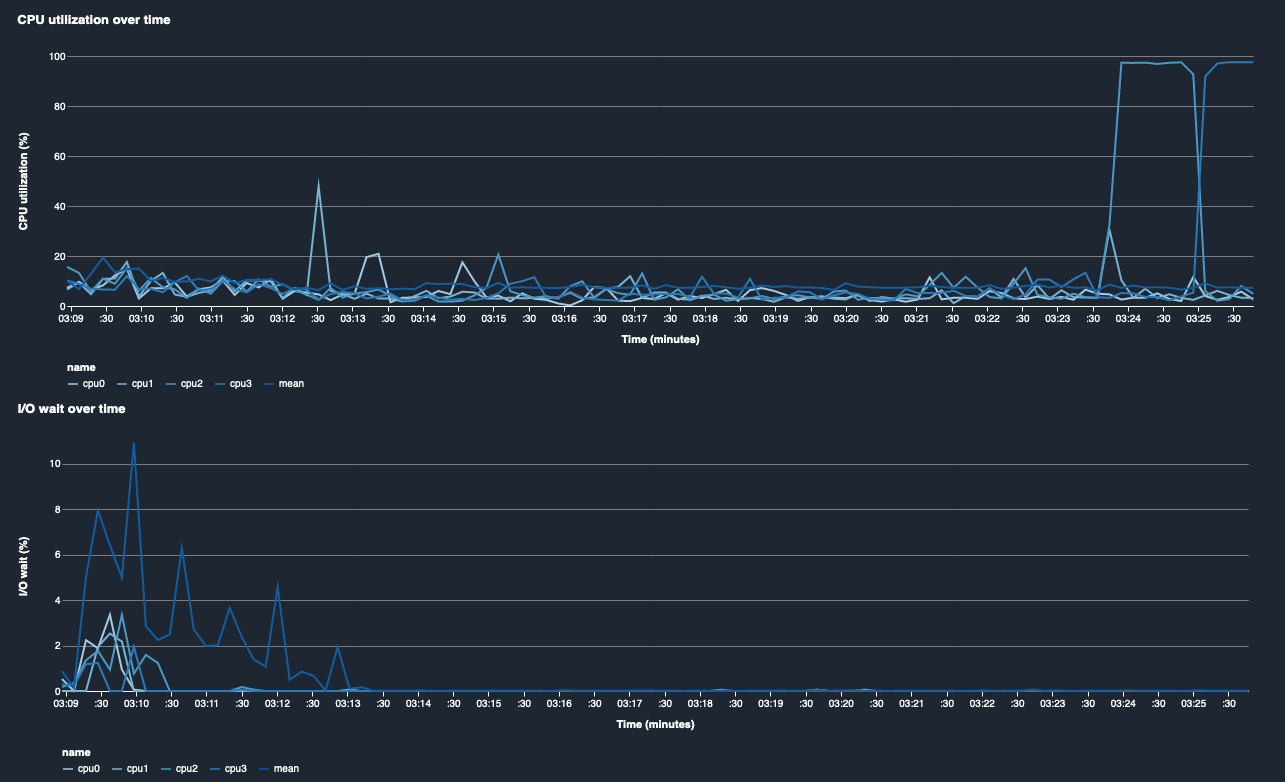
The first two graphs show CPU utilization and I/O wait time over time. By default, the graphs show the average of CPU utilization rate and I/O wait time spent on the CPU cores. You can select one or more CPU cores by selecting the labels to graph them on single chart and compare utilization across cores. You can drag and zoom in and out to have a closer look at specific time intervals.
GPU utilization and GPU memory utilization
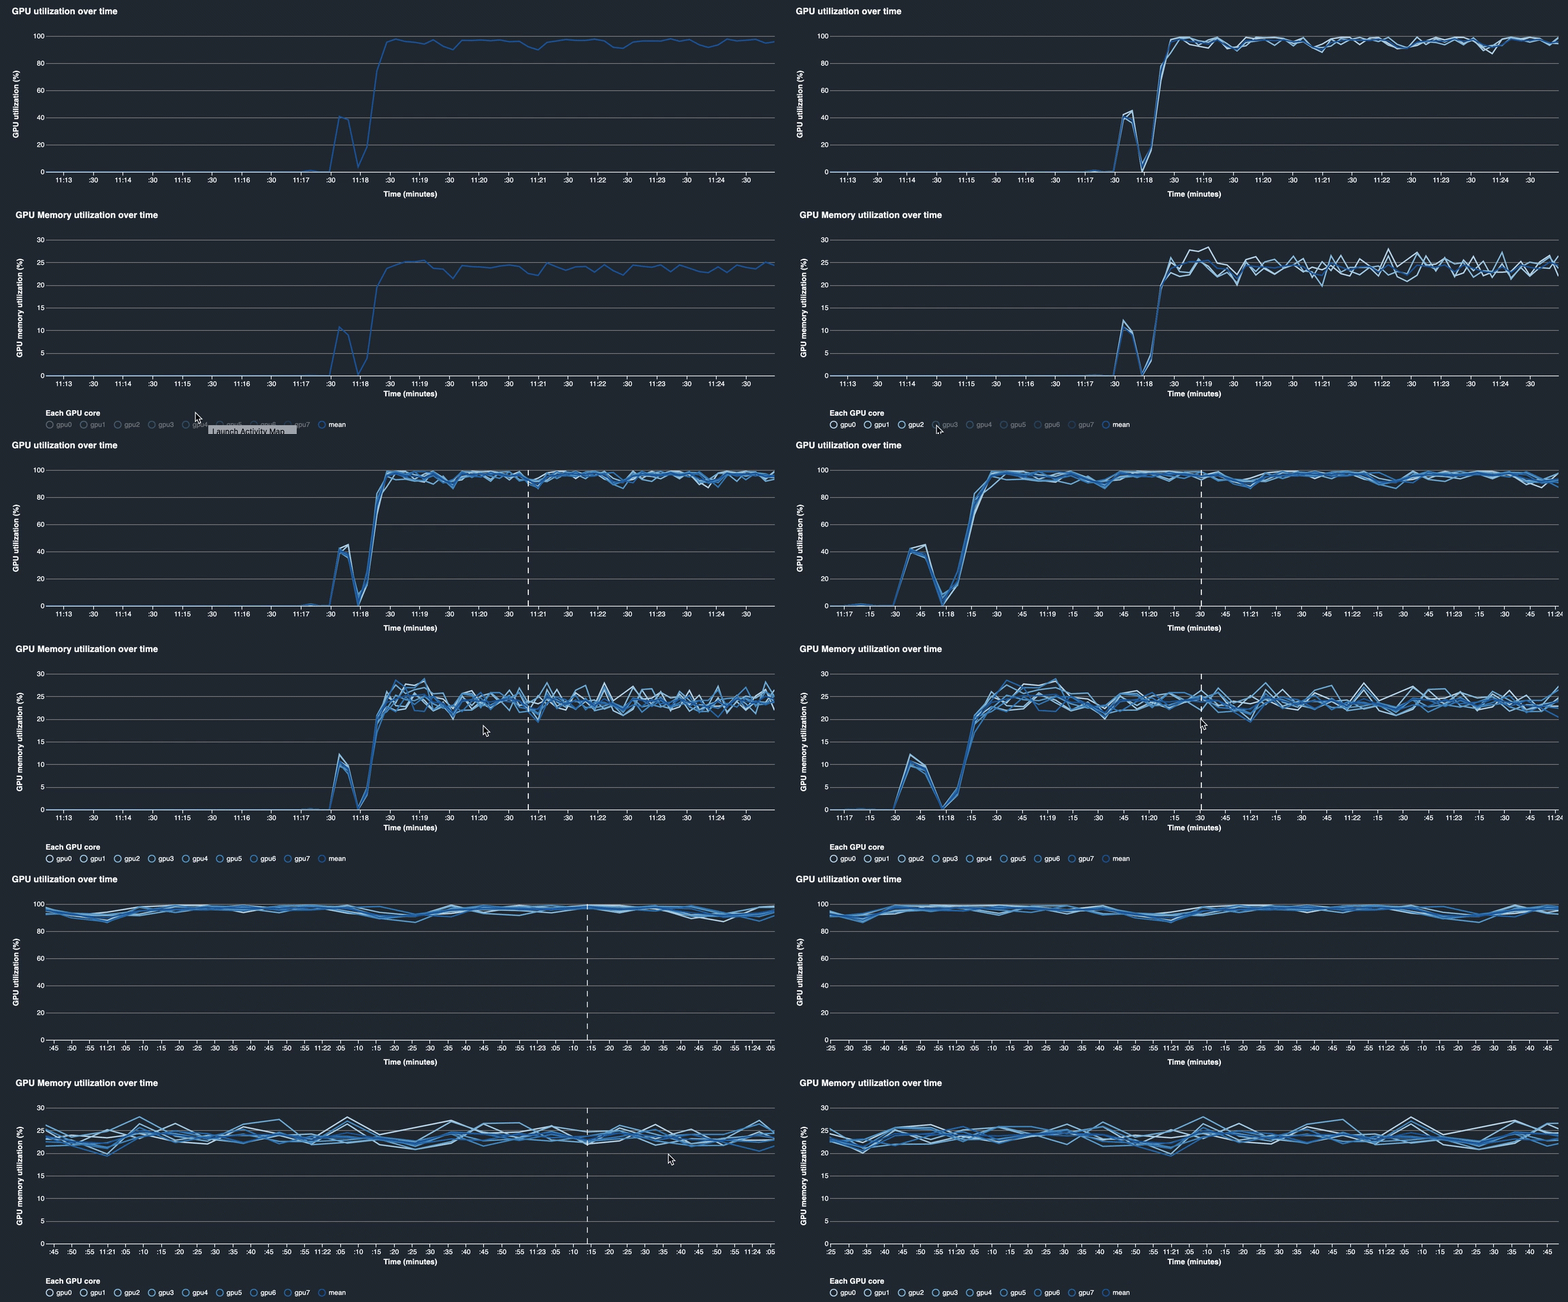
The following graphs show GPU utilization and GPU memory utilization over time. By
default, the graphs show the mean utilization rate over time. You can select the GPU
core labels to see the utilization rate of each core. Taking the mean of utilization
rate over the total number of GPU cores shows the mean utilization of the entire
hardware system resource. By looking at the mean utilization rate, you can check the
overall system resource usage of an Amazon EC2 instance. The following figure shows an
example training job on an ml.p3.16xlarge instance with 8 GPU cores.
You can monitor if the training job is well distributed, fully utilizing all
GPUs.
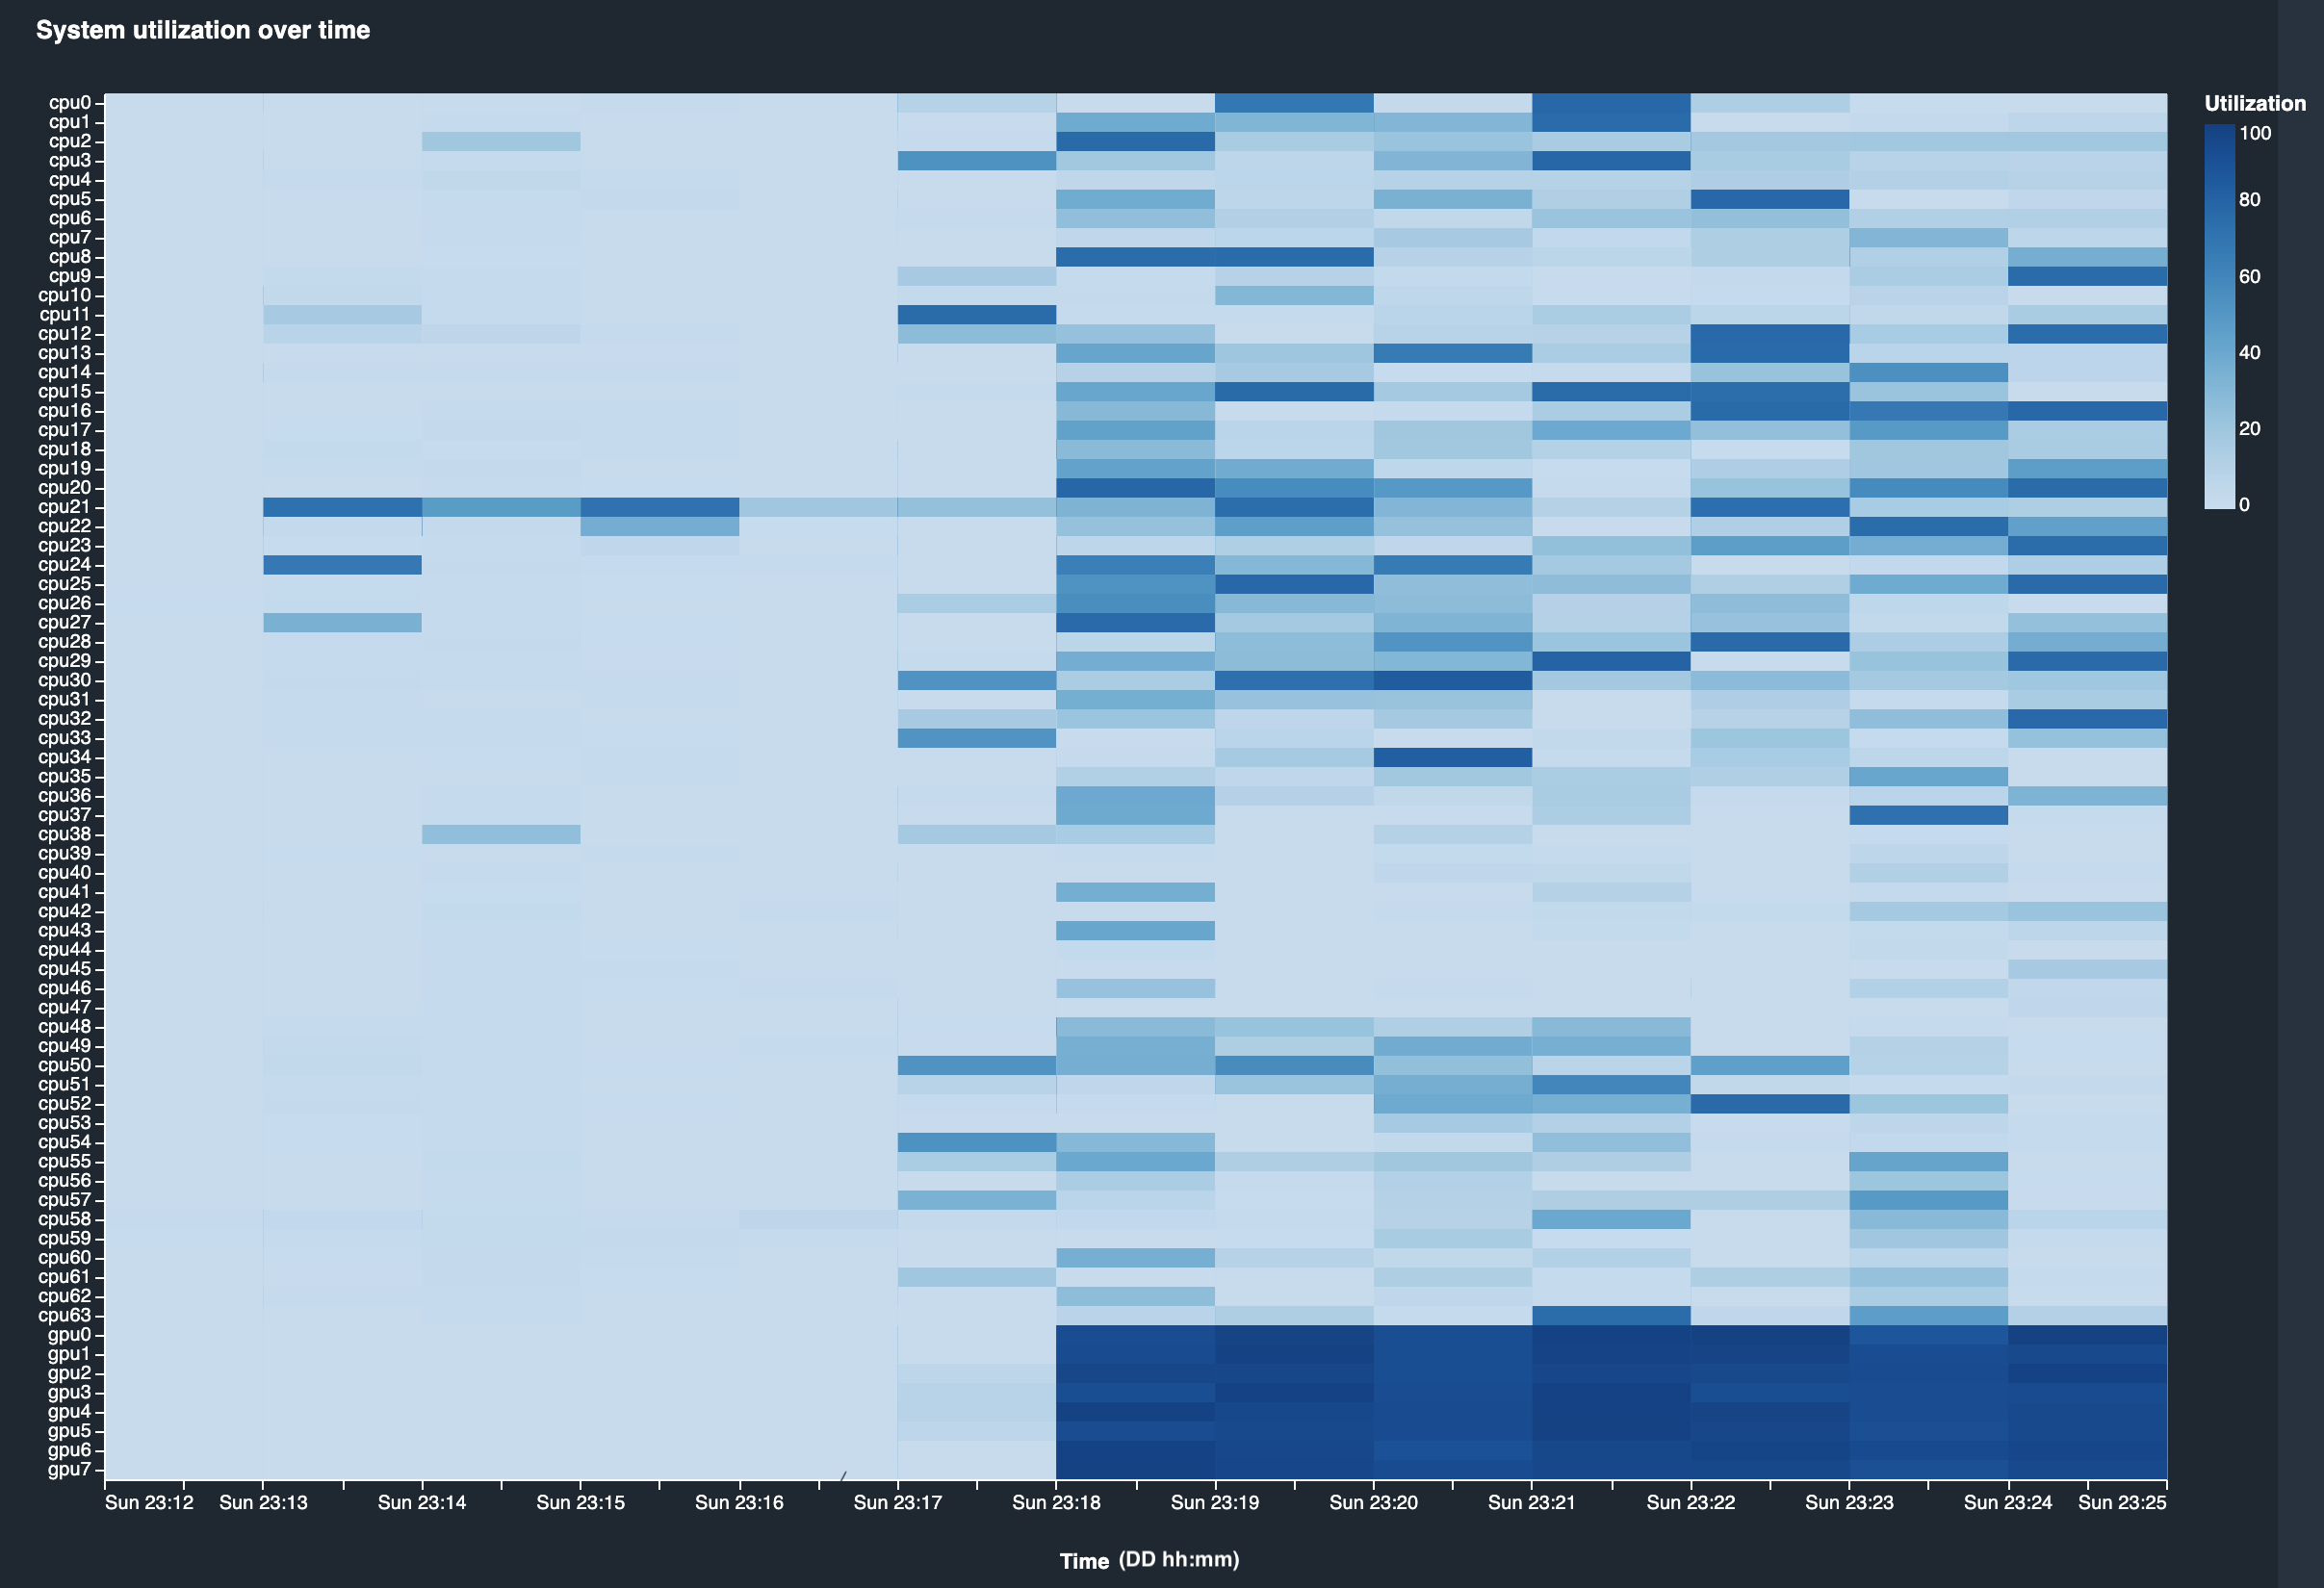
Overall system utilization over time
The following heatmap shows an example of the entire system utilization of an
ml.p3.16xlarge instance over time, projected onto the
two-dimensional plot. Every CPU and GPU core is listed in the vertical axis, and the
utilization is recorded over time with a color scheme, where the bright colors
represent low utilization and the darker colors represent high utilization. See the
labeled color bar on the right side of the plot to find out which color level
corresponds to which utilization rate.
Rules
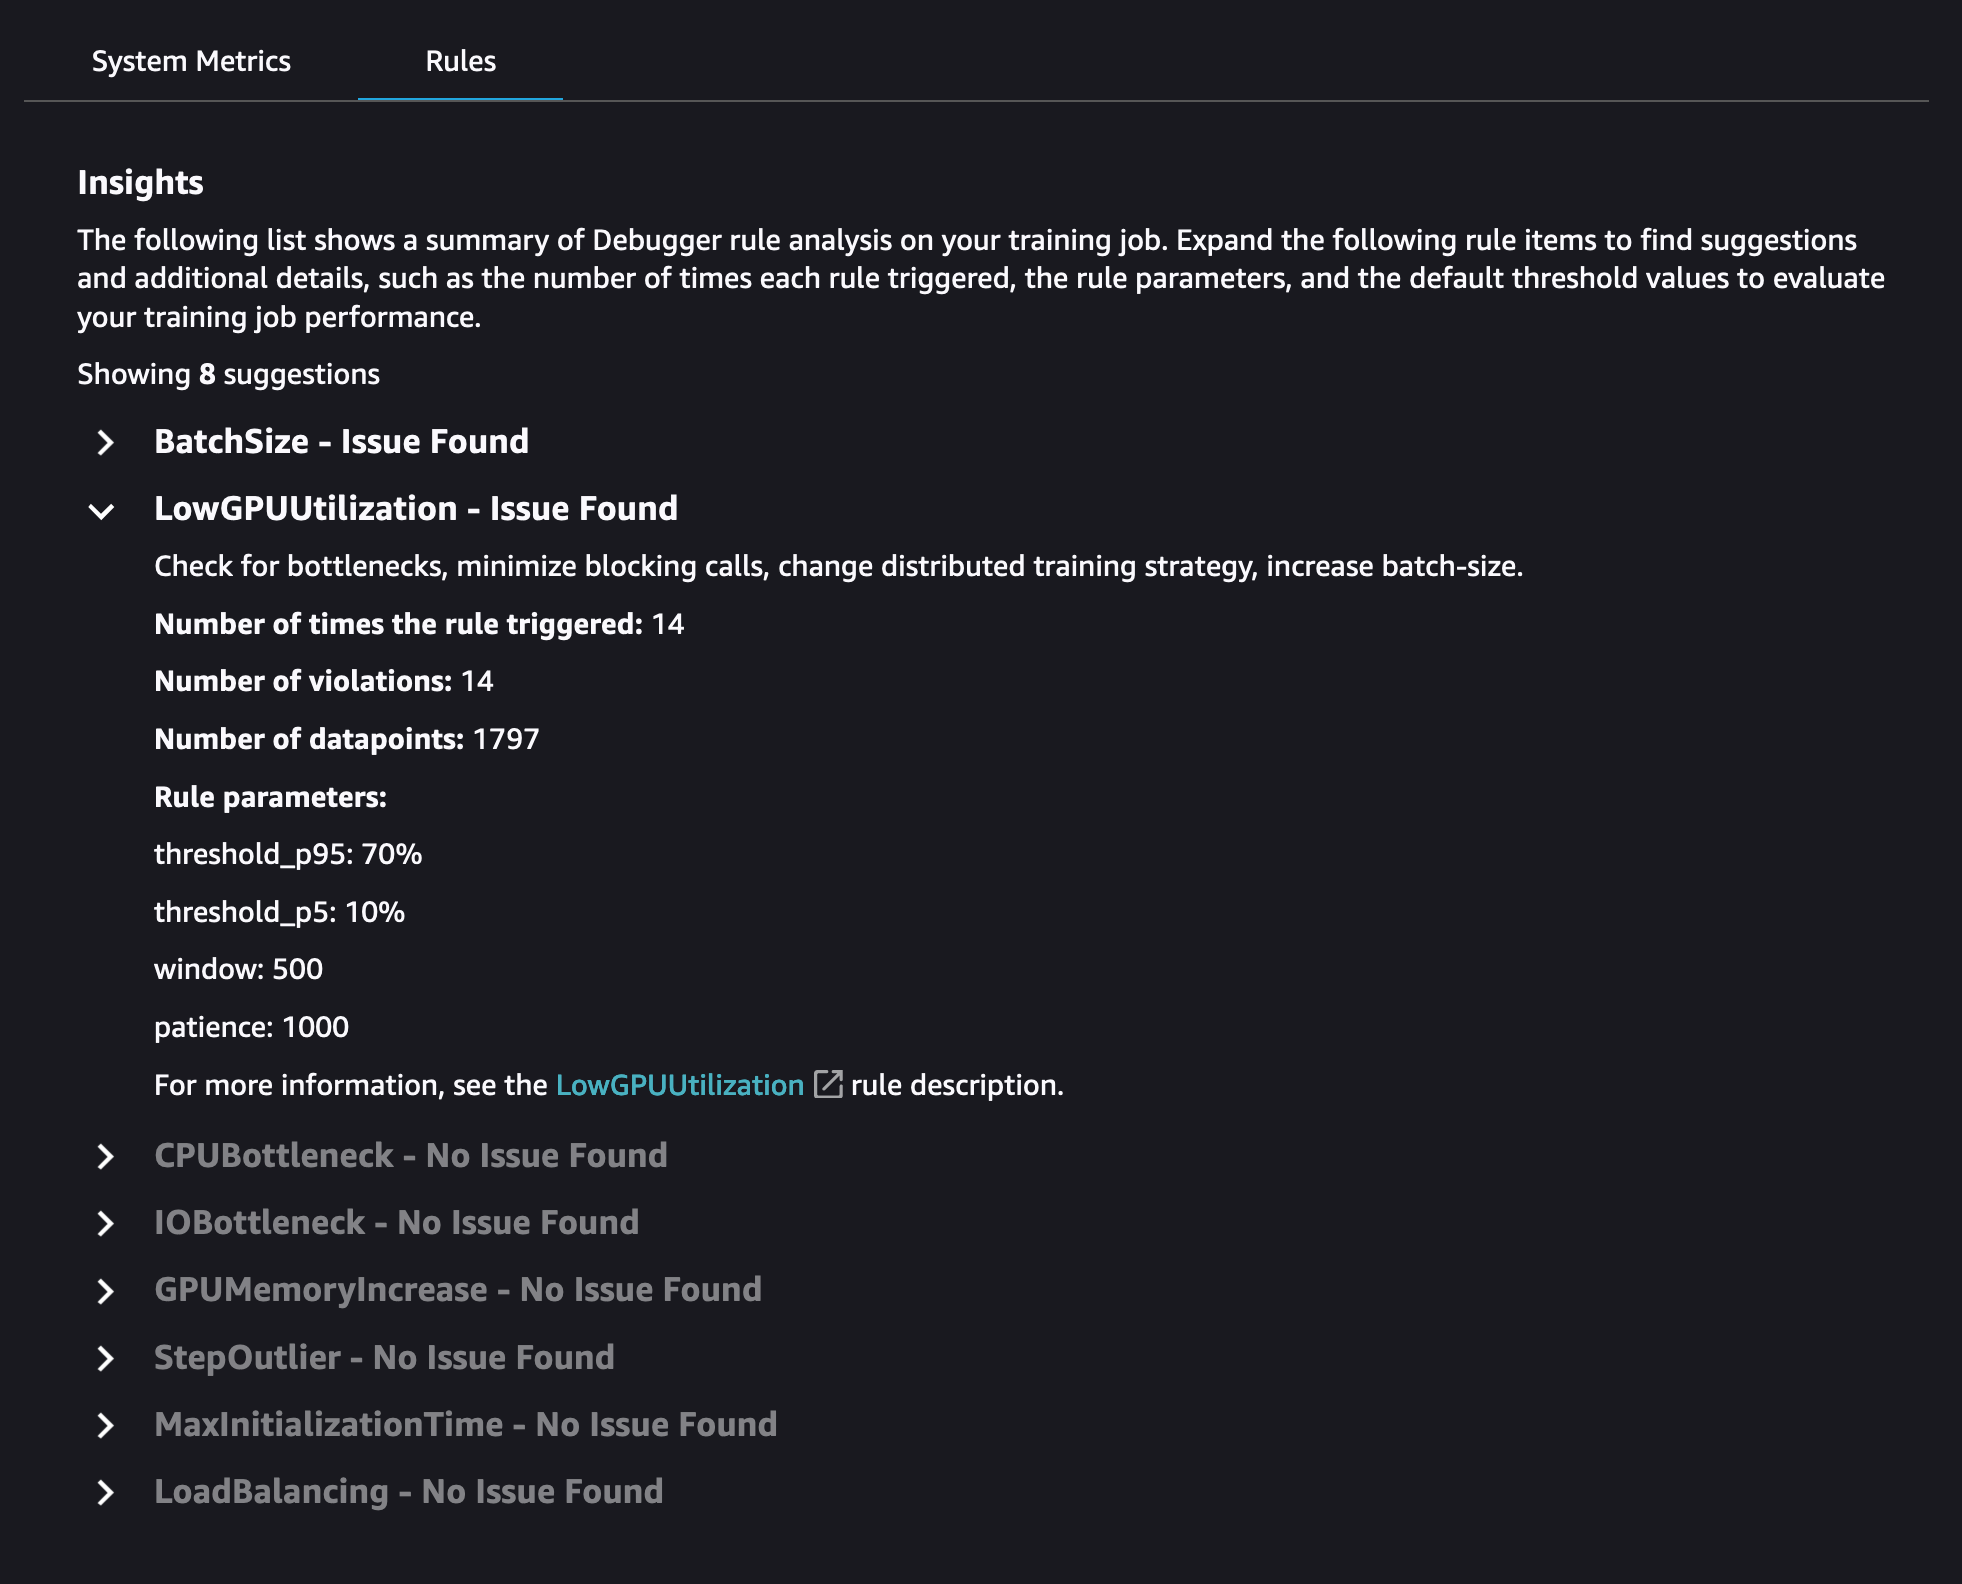
Use the Rules tab to find a summary of the profiling rule analysis on your training job. If the profiling rule is activated with the training job, the text appears highlighted with the solid white text. Inactive rules are dimmed in gray text. To activate these rules, follow instructions at Use built-in profiler rules managed by Amazon SageMaker Debugger.
