Evaluate the model
Now that you have trained and deployed a model using Amazon SageMaker AI, evaluate the model to ensure that it generates accurate predictions on new data. For model evaluation, use the test dataset that you created in Prepare a dataset.
Evaluate the Model Deployed to SageMaker AI Hosting Services
To evaluate the model and use it in production, invoke the endpoint with the test dataset and check whether the inferences you get returns a target accuracy you want to achieve.
To evaluate the model
-
Set up the following function to predict each line of the test set. In the following example code, the
rowsargument is to specify the number of lines to predict at a time. You can change the value of it to perform a batch inference that fully utilizes the instance's hardware resource.import numpy as np from sagemaker.core.resources import Endpoint def predict(data, endpoint_name, rows=1000): xgb_endpoint = Endpoint.get(endpoint_name=endpoint_name) split_array = np.array_split(data, int(data.shape[0] / float(rows) + 1)) predictions = '' for array in split_array: response = xgb_endpoint.invoke(body=array.tostring(), content_type="text/csv") predictions = ','.join([predictions, response.body.read().decode('utf-8')]) return np.fromstring(predictions[1:], sep=',') -
Run the following code to make predictions of the test dataset and plot a histogram. You need to take only the feature columns of the test dataset, excluding the 0th column for the actual values.
import matplotlib.pyplot as plt

predictions=predict(test.to_numpy()[:,1:])
plt.hist(predictions)
plt.show()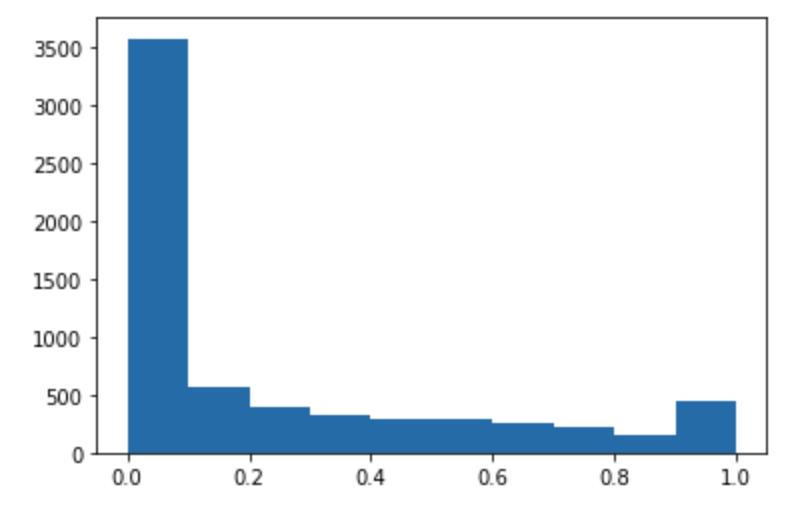
-
The predicted values are float type. To determine
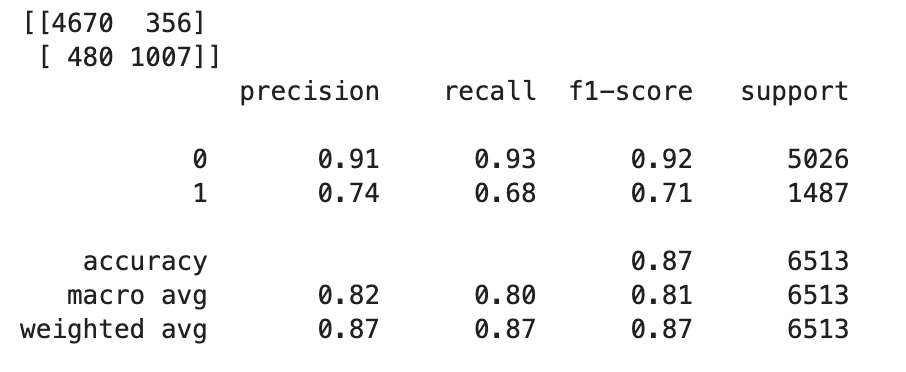
TrueorFalsebased on the float values, you need to set a cutoff value. As shown in the following example code, use the Scikit-learn library to return the output confusion metrics and classification report with a cutoff of 0.5.import sklearn cutoff=0.5 print(sklearn.metrics.confusion_matrix(test.iloc[:, 0], np.where(predictions > cutoff, 1, 0))) print(sklearn.metrics.classification_report(test.iloc[:, 0], np.where(predictions > cutoff, 1, 0)))This should return the following confusion matrix:
-
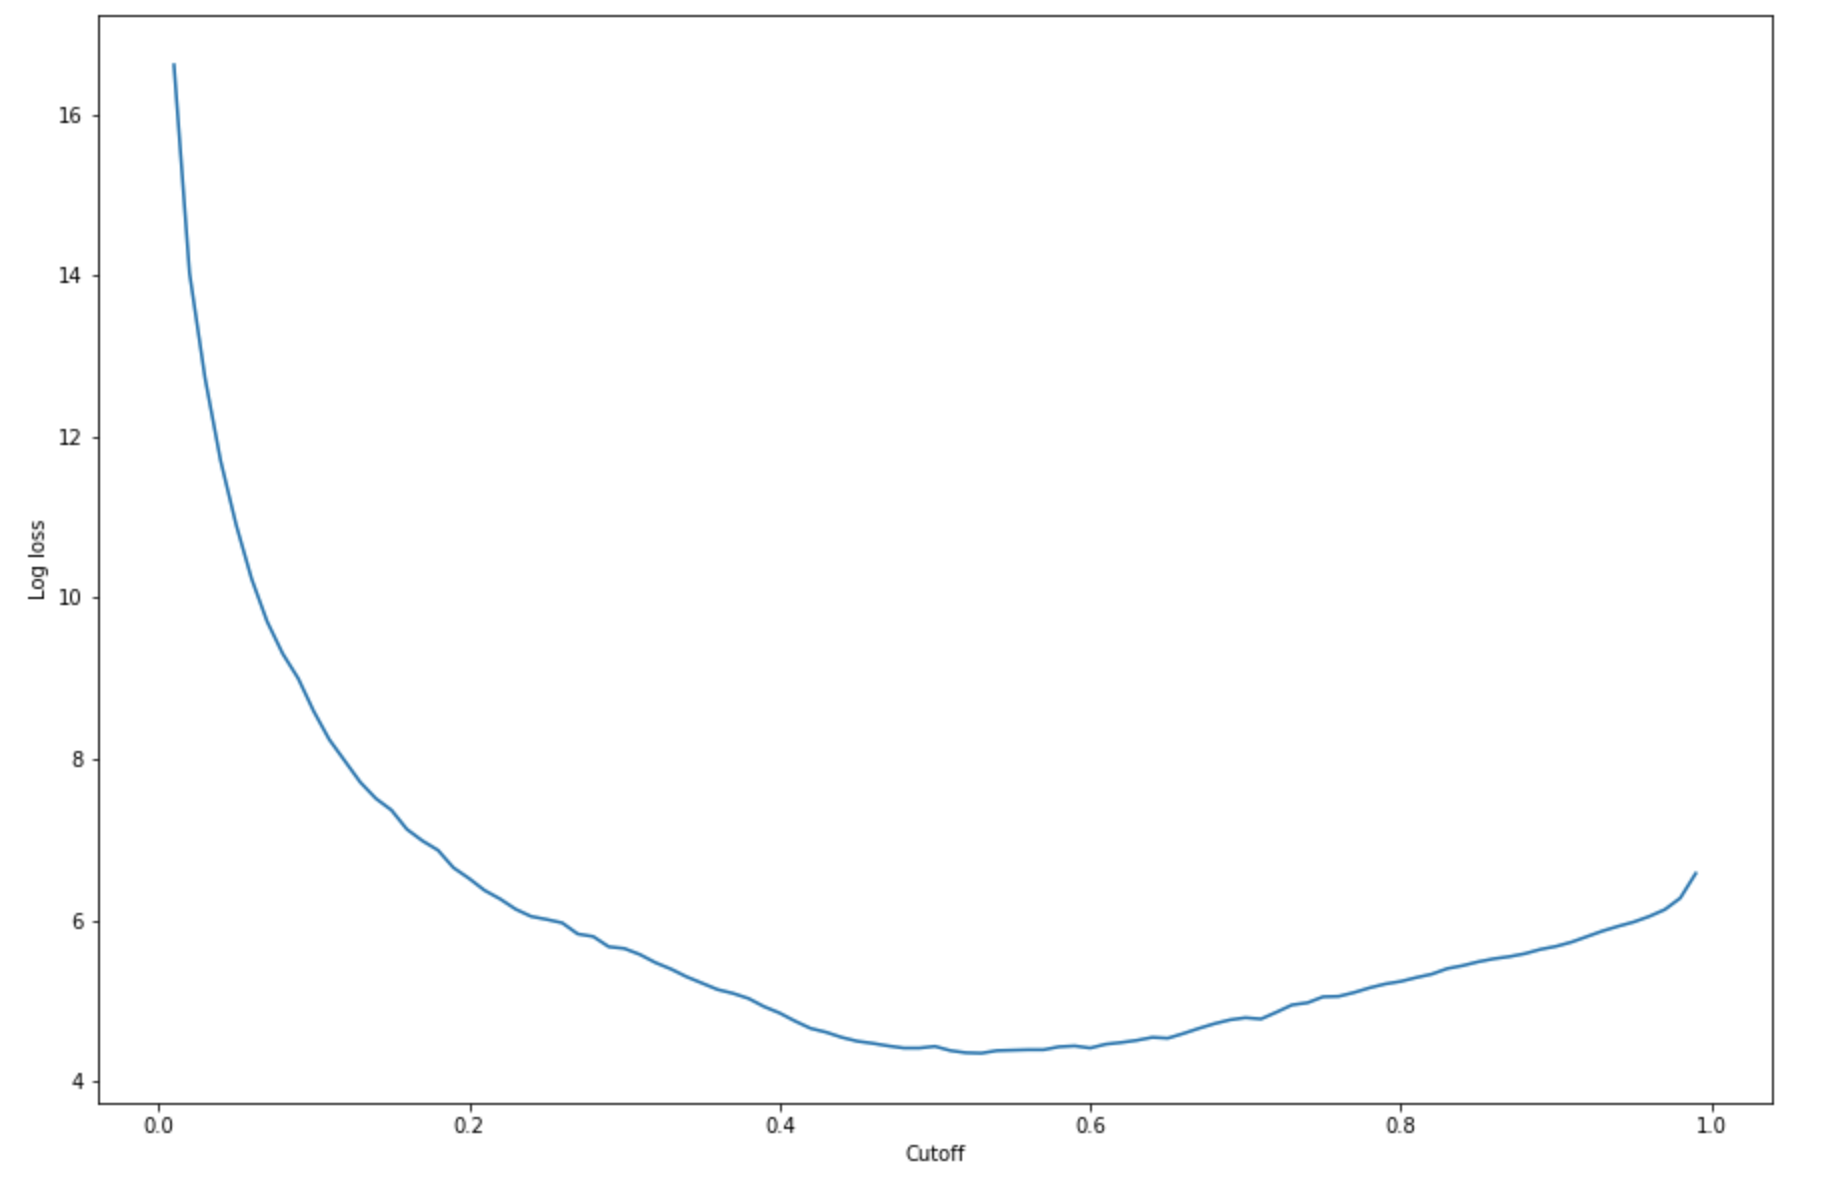
To find the best cutoff with the given test set, compute the log loss function of the logistic regression. The log loss function is defined as the negative log-likelihood of a logistic model that returns prediction probabilities for its ground truth labels. The following example code numerically and iteratively calculates the log loss values (
-(y*log(p)+(1-y)log(1-p)), whereyis the true label andpis a probability estimate of the corresponding test sample. It returns a log loss versus cutoff graph.import matplotlib.pyplot as plt cutoffs = np.arange(0.01, 1, 0.01) log_loss = [] for c in cutoffs: log_loss.append( sklearn.metrics.log_loss(test.iloc[:, 0], np.where(predictions > c, 1, 0)) ) plt.figure(figsize=(15,10)) plt.plot(cutoffs, log_loss) plt.xlabel("Cutoff") plt.ylabel("Log loss") plt.show()This should return the following log loss curve.
-
Find the minimum points of the error curve using the NumPy
argminandminfunctions:print( 'Log loss is minimized at a cutoff of ', cutoffs[np.argmin(log_loss)], ', and the log loss value at the minimum is ', np.min(log_loss) )This should return:
Log loss is minimized at a cutoff of 0.53, and the log loss value at the minimum is 4.348539186773897.Instead of computing and minimizing the log loss function, you can estimate a cost function as an alternative. For example, if you want to train a model to perform a binary classification for a business problem such as a customer churn prediction problem, you can set weights to the elements of confusion matrix and calculate the cost function accordingly.
You have now trained, deployed, and evaluated your first model in SageMaker AI.
Tip
To monitor model quality, data quality, and bias drift, use Amazon SageMaker Model Monitor and SageMaker AI Clarify. To learn more, see Amazon SageMaker Model Monitor, Monitor Data Quality, Monitor Model Quality, Monitor Bias Drift, and Monitor Feature Attribution Drift.
Tip
To get human review of low confidence ML predictions or a random sample of predictions, use Amazon Augmented AI human review workflows. For more information, see Using Amazon Augmented AI for Human Review.