Inference Pipeline Logs and Metrics
Monitoring is important for maintaining the reliability, availability, and performance of Amazon SageMaker AI resources. To monitor and troubleshoot inference pipeline performance, use Amazon CloudWatch logs and error messages. For information about the monitoring tools that SageMaker AI provides, see Monitoring Amazon resources in Amazon SageMaker AI.
Use Metrics to Monitor Multi-container Models
To monitor the multi-container models in Inference Pipelines, use Amazon CloudWatch. CloudWatch
collects raw data and processes it into readable, near real-time metrics. SageMaker AI
training jobs and endpoints write CloudWatch metrics and logs in the
AWS/SageMaker namespace.
The following tables list the metrics and dimensions for the following:
-
Endpoint invocations
-
Training jobs, batch transform jobs, and endpoint instances
A dimension is a name/value pair that uniquely identifies a metric. You can assign up to 10 dimensions to a metric. For more information on monitoring with CloudWatch, see Amazon SageMaker AI metrics in Amazon CloudWatch.
Endpoint Invocation Metrics
The AWS/SageMaker namespace includes the following request metrics
from calls to InvokeEndpoint.
Metrics are reported at a 1-minute intervals.
| Metric | Description |
|---|---|
Invocation4XXErrors |
The number of Units: None Valid statistics: |
Invocation5XXErrors |
The number of Units: None Valid statistics: |
Invocations |
The To get the total number of requests sent to a model endpoint,
use the Units: None Valid statistics: |
InvocationsPerInstance |
The number of endpoint invocations sent to a model, normalized
by Units: None Valid statistics: |
ModelLatency |
The time the model or models took to respond. This includes the
time it took to send the request, to fetch the response from the
model container, and to complete the inference in the container.
ModelLatency is the total time taken by all
containers in an inference pipeline.Units: Microseconds Valid statistics: |
OverheadLatency |
The time added to the time taken to respond to a client
request by SageMaker AI for overhead. Units: Microseconds Valid statistics: |
ContainerLatency |
The time it took for an Inference Pipelines container to respond
as viewed from SageMaker AI. ContainerLatency includes the time
it took to send the request, to fetch the response from the model's
container, and to complete inference in the container.Units: Microseconds Valid statistics: |
Dimensions for Endpoint Invocation Metrics
| Dimension | Description |
|---|---|
EndpointName, VariantName, ContainerName |
Filters endpoint invocation metrics for a
|
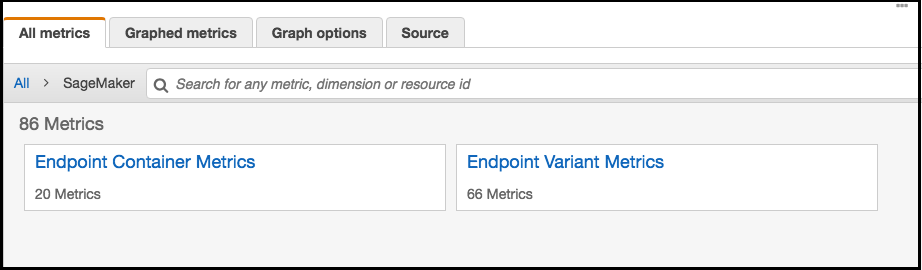
For an inference pipeline endpoint, CloudWatch lists per-container latency metrics in
your account as Endpoint Container Metrics and
Endpoint Variant Metrics in the SageMaker AI
namespace, as follows. The ContainerLatency metric appears only for
inferences pipelines.
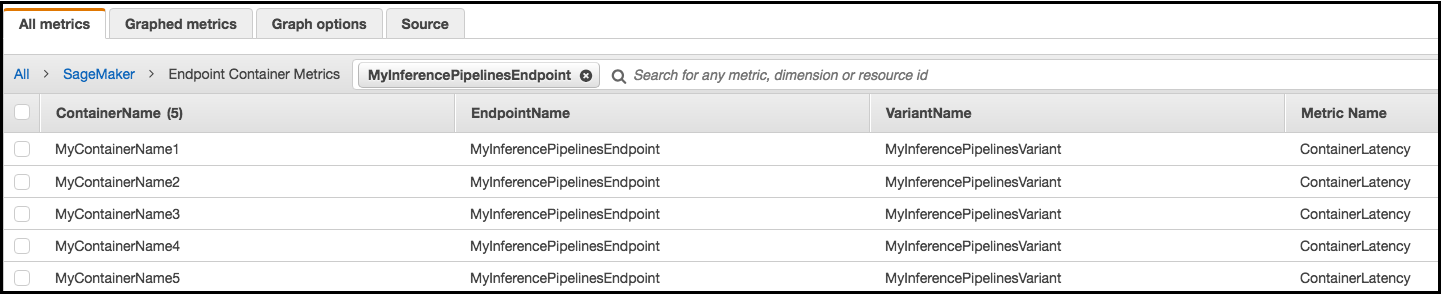
For each endpoint and each container, latency metrics display names for the container, endpoint, variant, and metric.
Training Job, Batch Transform Job, and Endpoint Instance Metrics
The namespaces /aws/sagemaker/TrainingJobs,
/aws/sagemaker/TransformJobs, and
/aws/sagemaker/Endpoints include the following metrics for training
jobs and endpoint instances.
Metrics are reported at a 1-minute intervals.
| Metric | Description |
|---|---|
CPUUtilization |
The percentage of CPU units that are used by the containers
running on an instance. The value ranges from 0% to 100%, and is
multiplied by the number of CPUs. For example, if there are four
CPUs, For training jobs, For batch transform jobs, For multi-container models, For endpoint variants, Units: Percent |
MemoryUtilization |
The percentage of memory that is used by the containers running on an instance. This value ranges from 0% to 100%. For training jobs,
For
batch transform jobs, MemoryUtilization is the sum of memory used by all
containers running on the instance.For endpoint variants,
Units: Percent |
GPUUtilization |
The percentage of GPU units that are used by the containers
running on an instance. For training jobs, For batch transform jobs, For multi-container models, For endpoint variants, Units: Percent |
GPUMemoryUtilization |
The percentage of GPU memory used by the containers running on
an instance. GPUMemoryUtilization ranges from 0% to 100% and is
multiplied by the number of GPUs. For example, if there are four
GPUs, For training jobs, For batch transform jobs, For multi-container models, For endpoint variants, Units: Percent |
DiskUtilization |
The percentage of disk space used by the containers running on an instance. DiskUtilization ranges from 0% to 100%. This metric is not supported for batch transform jobs. For training jobs, For endpoint variants, Units: Percent |
Dimensions for Training Job, Batch Transform Job, and Endpoint Instance Metrics
| Dimension | Description |
|---|---|
Host |
For training jobs, For batch transform jobs, For endpoints, |
To help you debug your training jobs, endpoints, and notebook instance lifecycle
configurations, SageMaker AI also sends anything an algorithm container, a model container,
or a notebook instance lifecycle configuration sends to stdout or
stderr to Amazon CloudWatch Logs. You can use this information for debugging and
to analyze progress.
Use Logs to Monitor an Inference Pipeline
The following table lists the log groups and log streams SageMaker AI. sends to Amazon CloudWatch
A log stream is a sequence of log events that share the same source. Each separate source of logs into CloudWatch makes up a separate log stream. A log group is a group of log streams that share the same retention, monitoring, and access control settings.
Logs
| Log Group Name | Log Stream Name |
|---|---|
/aws/sagemaker/TrainingJobs |
|
/aws/sagemaker/Endpoints/[EndpointName] |
|
|
|
|
|
|
|
/aws/sagemaker/NotebookInstances |
|
/aws/sagemaker/TransformJobs |
|
|
|
|
|
|
Note
SageMaker AI creates the /aws/sagemaker/NotebookInstances log group when
you create a notebook instance with a lifecycle configuration. For more
information, see Customization of a SageMaker notebook instance using an LCC script.
For more information about SageMaker AI logging, see CloudWatch Logs for Amazon SageMaker AI.