Amazon SageMaker AI metrics in Amazon CloudWatch
You can monitor Amazon SageMaker AI using Amazon CloudWatch, which collects raw data and processes it into readable, near real-time metrics. These statistics are kept for 15 months. With them, you can access historical information and gain a better perspective on how your web application or service is performing. However, the Amazon CloudWatch console limits the search to metrics that were updated in the last 2 weeks. This limitation ensures that the most current jobs are shown in your namespace.
To graph metrics without using a search, specify its exact name in the source view. You can also set alarms that watch for certain thresholds, and send notifications or take actions when those thresholds are met. For more information, see the Amazon CloudWatch User Guide.
SageMaker AI Metrics and Dimensions
SageMaker AI endpoint metrics
The /aws/sagemaker/Endpoints namespace includes the following metrics for
endpoint instances.
Metrics are available at a 1-minute frequency. You can configure the publishing
frequency to 10, 30, 60, 120, 180, 240, or 300 seconds by setting
MetricPublishFrequencyInSeconds in MetricsConfig. This setting does not require EnableEnhancedMetrics
to be enabled. When you set EnableEnhancedMetrics to True,
the additional dimensions InstanceId and AcceleratorId
(GPU metrics only) are available. For more
information, see Amazon SageMaker AI enhanced metrics for inference endpoints.
Note
Amazon CloudWatch supports high-resolution custom metrics and its finest resolution is 1 second. However, the finer the resolution, the shorter the lifespan of the CloudWatch metrics. For the 1-second frequency resolution, the CloudWatch metrics are available for 3 hours. For more information about the resolution and the lifespan of the CloudWatch metrics, see GetMetricStatistics in the Amazon CloudWatch API Reference.
| Metric | Description |
|---|---|
CPUReservation |
The sum of CPUs reserved by containers on an instance. This metric is provided only for endpoints that host active inference components. The value ranges between 0%–100%. In the
settings for an inference component, you set the CPU reservation with the
|
CPUUtilization |
The sum of each individual CPU core's utilization. The CPU utilization of each
core range is 0–100. For example, if there are four CPUs, the
For endpoint variants, the value is the sum of the CPU utilization of the primary and supplementary containers on the instance. Units: Percent |
CPUUtilizationNormalized |
The normalized sum of the utilization of each individual CPU core. This metric is provided only for endpoints that host active inference components. The value ranges between 0%–100%. For
example, if there are four CPUs, and the |
DiskUtilization |
The percentage of disk space used by the containers on an instance. This value range is 0%–100%. For endpoint variants, the value is the sum of the disk space utilization of the primary and supplementary containers on the instance.Units: Percent |
GPUMemoryUtilization |
The percentage of GPU memory used by the containers on an instance. The
value range is 0–100 and is multiplied by the number of GPUs. For example,
if there are four GPUs, the For endpoint variants, the value is the sum of the GPU memory utilization of the primary and supplementary containers on the instance. Units: Percent |
GPUMemoryUtilizationNormalized |
The normalized percentage of GPU memory used by the containers on an instance. This metric is provided only for endpoints that host active inference components. The value ranges between
0%–100%. For example, if there are four GPUs, and the
|
GPUReservation |
The sum of GPUs reserved by containers on an instance. This metric is provided only for endpoints that host active inference components. The value ranges between 0%–100%. In the
settings for an inference component, you set the GPU reservation by
|
GPUUtilization |
The percentage of GPU units that are used by the containers on an
instance. The value can range between 0–100 and is multiplied by the number
of GPUs. For example, if there are four GPUs, the For endpoint variants, the value is the sum of the GPU utilization of the primary and supplementary containers on the instance. Units: Percent |
GPUUtilizationNormalized |
The normalized percentage of GPU units that are used by the containers on an instance. This metric is provided only for endpoints that host active inference components. The value ranges between
0%–100%. For example, if there are four GPUs, and the
|
MemoryReservation |
The sum of memory reserved by containers on an instance. This metric is provided only for endpoints that host active inference components. The value ranges between 0%–100%. In the
settings for an inference component, you set the memory reservation with the
|
MemoryUtilization |
The percentage of memory that is used by the containers on an instance. This value range is 0%–100%. For endpoint variants, the value is the sum of the memory utilization of the primary and supplementary containers on the instance. Units: Percent |
| Dimension | Description |
|---|---|
EndpointName, VariantName |
Filters endpoint metrics for a |
EndpointName, VariantName, InstanceType |
Filters endpoint metrics by instance type for a production variant that uses instance pools. Use this dimension to monitor metrics for each instance type within the variant separately. |
InstanceId |
Filters endpoint metrics for a specific instance. Available when
|
AcceleratorId |
(GPU metrics only) Filters endpoint metrics for a specific GPU. Available when
|
SageMaker AI endpoint invocation metrics
The AWS/SageMaker namespace includes the following request metrics from
calls to
InvokeEndpoint.
Metrics are available at a 1-minute frequency. You can configure the publishing
frequency to 10, 30, 60, 120, 180, 240, or 300 seconds by setting
MetricPublishFrequencyInSeconds in MetricsConfig. For invocation metrics, this setting requires
EnableEnhancedMetrics to be set to True.
When you set EnableEnhancedMetrics to
True, the additional dimensions InstanceId and
ContainerId (inference components only) are also available. For more
information, see Amazon SageMaker AI enhanced metrics for inference endpoints.
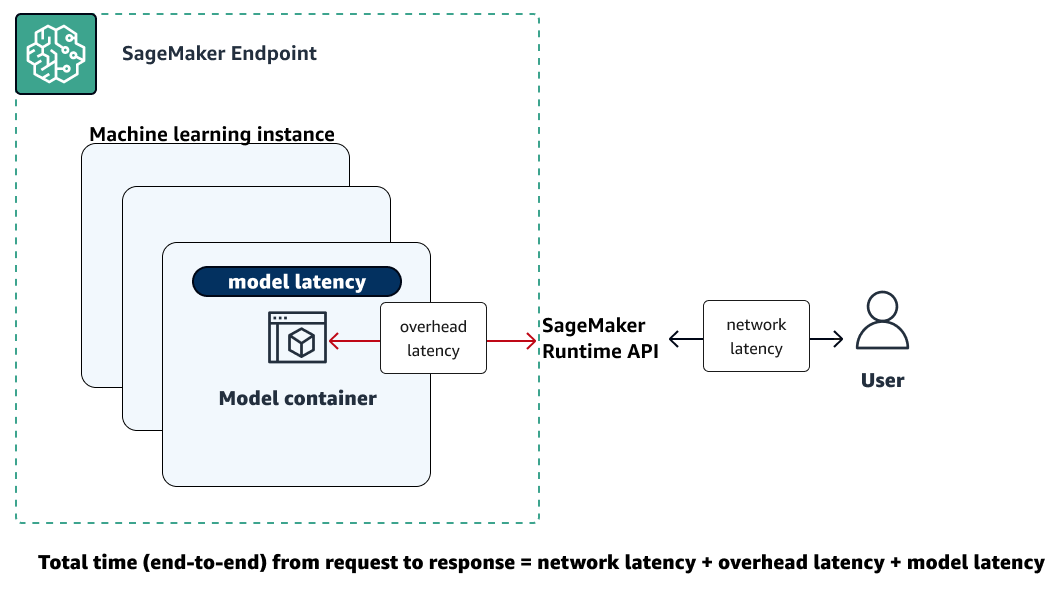
The following illustration shows how a SageMaker AI endpoint interacts with the Amazon SageMaker Runtime API. The overall time between sending a request to an endpoint and receiving a response depends on the following three components.
-
Network latency – the time that it takes between making a request to and receiving a response back from the SageMaker Runtime Runtime API.
-
Overhead latency – the time that it takes to transport a request to the model container from and transport the response back to the SageMaker Runtime Runtime API.
-
Model latency – the time that it takes the model container to process the request and return a response.
For more information about total latency, see Best practices for load testing Amazon SageMaker AI real-time inference endpoints
| Metric | Description |
|---|---|
ConcurrentRequestsPerCopy |
The number of concurrent requests being received by the inference component, normalized by each copy of an inference component. Valid statistics: Min, Max |
ConcurrentRequestsPerModel |
The number of concurrent requests being received by the model. Valid statistics: Min, Max |
Invocation4XXErrors |
The number of Units: None Valid statistics: Average, Sum |
Invocation5XXErrors |
The number of Units: None Valid statistics: Average, Sum |
InvocationModelErrors |
The number of model invocation requests that did not result in 2XX HTTP response. This includes 4XX/5XX status codes, low-level socket errors, malformed HTTP responses, and request timeouts. For each error response, 1 is sent; otherwise, 0 is sent. Units: None Valid statistics: Average, Sum |
Invocations |
The number of To get the total number of requests sent to a model endpoint, use the Sum statistic. Units: None Valid statistics: Sum |
InvocationsPerCopy |
The number of invocations normalized by each copy of an inference component. Valid statistics: Sum |
InvocationsPerInstance |
The number of invocations sent to a model, normalized by
Units: None Valid statistics: Sum |
ModelLatency |
The interval of time taken by a model to respond to a SageMaker Runtime API request. This interval includes the local communication times taken to send the request and to fetch the response from the model container. It also includes the time taken to complete the inference in the container. Units: Microseconds Valid statistics: Average, Sum, Min, Max, Sample Count, Percentiles |
ModelSetupTime |
The time it takes to launch new compute resources for a serverless endpoint. The time can vary depending on the model size, how long it takes to download the model, and the start-up time of the container. Units: Microseconds Valid statistics: Average, Min, Max, Sample Count, Percentiles |
OverheadLatency |
The interval of time added to the time taken to respond to a client request by
SageMaker AI overheads. This interval is measured from the time SageMaker AI receives the request
until it returns a response to the client, minus the Units: Microseconds Valid statistics: Average, Sum, Min, Max, Sample Count |
MidStreamErrors
|
The number of errors that occur during response streaming after the initial response has been sent to the customer. Units: None Valid statistics: Average, Sum |
FirstChunkLatency
|
The time elapsed from when the request arrives at SageMaker AI endpoint until the first chunk of the response is sent to the customer. This metric applies to bidirectional streaming inference requests. Units: Microseconds Valid statistics: Average, Sum, Min, Max, Sample Count, Percentiles |
FirstChunkModelLatency
|
The time taken by the model container to process the request and return the first chunk of the response. This is measured from when the request is sent to the model container until the first byte is received from the model. This metric applies to bidirectional streaming inference requests. Units: Microseconds Valid statistics: Average, Sum, Min, Max, Sample Count, Percentiles |
FirstChunkOverheadLatency
|
The overhead latency for the first chunk, excluding model processing time.
This is calculated as Units: Microseconds Valid statistics: Average, Sum, Min, Max, Sample Count, Percentile |
| Dimension | Description |
|---|---|
EndpointName, VariantName |
Filters endpoint invocation metrics for a |
EndpointName, VariantName, InstanceType |
Filters endpoint invocation metrics by instance type for a production variant that uses instance pools. Use this dimension to view invocation patterns for each instance type within the variant. |
InferenceComponentName |
Filters inference component invocation metrics. |
InstanceId |
Filters invocation metrics for a specific instance. Available when
|
ContainerId |
(Inference components only) Filters invocation metrics for a specific container. Available when
|
SageMaker AI inference component metrics
The /aws/sagemaker/InferenceComponents namespace includes the following
metrics from calls to
InvokeEndpoint for endpoints that host inference components.
Container-level granularity requires EnableEnhancedMetrics=True in the
endpoint configuration's MetricsConfig.
Metrics are available at a 1-minute frequency. You can configure the publishing
frequency to 10, 30, 60, 120, 180, 240, or 300 seconds by setting
MetricPublishFrequencyInSeconds in MetricsConfig. This setting
does not require EnableEnhancedMetrics to be enabled. When you set
EnableEnhancedMetrics to True, the additional dimensions
InstanceId, ContainerId, and AcceleratorId
(GPU metrics only) are available. For more
information, see Amazon SageMaker AI enhanced metrics for inference endpoints.
| Metric | Description |
|---|---|
CPUUtilizationNormalized |
The value of the |
GPUMemoryUtilizationNormalized |
The value of the |
GPUUtilizationNormalized |
The value of the |
MemoryUtilizationNormalized |
The value of |
| Dimension | Description |
|---|---|
InferenceComponentName |
Filters inference component metrics. |
InferenceComponentName, InstanceType |
Filters inference component metrics by instance type. Use this dimension when the inference component is deployed to a production variant with instance pools to view metrics for each instance type separately. |
InstanceId |
Filters inference component metrics for a specific instance. Available when
|
ContainerId |
Filters inference component metrics for a specific container. Available when
|
AcceleratorId |
(GPU metrics only) Filters inference component metrics for a specific GPU. Available when
|
SageMaker AI multi-model endpoint metrics
The AWS/SageMaker namespace includes the following model loading metrics
from calls to
InvokeEndpoint.
Metrics are available at a 1-minute frequency.
For information about how long CloudWatch metrics are retained for, see GetMetricStatistics in the Amazon CloudWatch API Reference.
| Metric | Description |
|---|---|
ModelLoadingWaitTime |
The interval of time that an invocation request has waited for the target model to be downloaded, loaded, or both in order to run inference. Units: Microseconds Valid statistics: Average, Sum, Min, Max, Sample Count |
ModelUnloadingTime |
The interval of time that it took to unload the model through the container's
Units: Microseconds Valid statistics: Average, Sum, Min, Max, Sample Count |
ModelDownloadingTime |
The interval of time that it took to download the model from Amazon Simple Storage Service (Amazon S3). Units: Microseconds Valid statistics: Average, Sum, Min, Max, Sample Count |
ModelLoadingTime |
The interval of time that it took to load the model through the container's
Units: Microseconds Valid statistics: Average, Sum, Min, Max, Sample Count |
ModelCacheHit |
The number of The Average statistic shows the ratio of requests for which the model was already loaded. Units: None Valid statistics: Average, Sum, Sample Count |
| Dimension | Description |
|---|---|
EndpointName, VariantName |
Filters endpoint invocation metrics for a |
The /aws/sagemaker/Endpoints namespaces include the following instance
metrics from calls to
InvokeEndpoint.
Metrics are available at a 1-minute frequency.
For information about how long CloudWatch metrics are retained for, see GetMetricStatistics in the Amazon CloudWatch API Reference.
| Metric | Description |
|---|---|
LoadedModelCount |
The number of models loaded in the containers of the multi-model endpoint. This metric is emitted per instance. The Average statistic with a period of 1 minute tells you the average number of models loaded per instance. The Sum statistic tells you the total number of models loaded across all instances in the endpoint. The models that this metric tracks are not necessarily unique because a model might be loaded in multiple containers at the endpoint. Units: None Valid statistics: Average, Sum, Min, Max, Sample Count |
| Dimension | Description |
|---|---|
EndpointName, VariantName |
Filters endpoint invocation metrics for a |
SageMaker AI job metrics
The /aws/sagemaker/ProcessingJobs,
/aws/sagemaker/TrainingJobs, and /aws/sagemaker/TransformJobs
namespaces include the following metrics for processing jobs, training jobs, and batch
transform jobs.
Metrics are available at a 1-minute frequency.
Note
Amazon CloudWatch supports high-resolution custom metrics and its finest resolution is 1 second. However, the finer the resolution, the shorter the lifespan of the CloudWatch metrics. For the 1-second frequency resolution, the CloudWatch metrics are available for 3 hours. For more information about the resolution and the lifespan of the CloudWatch metrics, see GetMetricStatistics in the Amazon CloudWatch API Reference.
Tip
To profile your training job with a finer resolution down to 100-millisecond (0.1 second) granularity and store the training metrics indefinitely in Amazon S3 for custom analysis at any time, consider using Amazon SageMaker Debugger. SageMaker Debugger provides built-in rules to automatically detect common training issues. It detects hardware resource utilization issues (such as CPU, GPU, and I/O bottlenecks). It also detects non-converging model issues (such as overfit, vanishing gradients, and exploding tensors). SageMaker Debugger also provides visualizations through Studio Classic and its profiling report. To explore the Debugger visualizations, see SageMaker Debugger Insights Dashboard Walkthrough, Debugger Profiling Report Walkthrough, and Analyze Data Using the SMDebug Client Library.
| Metric | Description |
|---|---|
CPUUtilization |
The sum of each individual CPU core's utilization. The CPU utilization of each
core range is 0–100. For example, if there are four CPUs, the
CPUUtilization range is 0%–400%. For processing jobs, the value is the CPU utilization of
the processing container on the instance.For training jobs, the value is the CPU utilization of the algorithm container on the instance. For batch transform jobs, the value is the CPU utilization of the transform container on the instance. NoteFor multi-instance jobs, each instance reports CPU utilization metrics. However, the default view in CloudWatch shows the average CPU utilization across all instances. Units: Percent |
DiskUtilization |
The percentage of disk space used by the containers on an instance. This value range is 0%–100%. This metric is not supported for batch transform jobs. For processing jobs, the value is the disk space utilization of the processing container on the instance.For training jobs, the value is the disk space utilization of the algorithm container on the instance. Units: Percent NoteFor multi-instance jobs, each instance reports disk utilization metrics. However, the default view in CloudWatch shows the average disk utilization across all instances. |
GPUMemoryUtilization |
The percentage of GPU memory used by the containers on an instance. The
value range is 0–100 and is multiplied by the number of GPUs. For example,
if there are four GPUs, the For training jobs, the value is the GPU memory utilization of the algorithm container on the instance. For batch transform jobs, the value is the GPU memory utilization of the transform container on the instance. NoteFor multi-instance jobs, each instance reports GPU memory utilization metrics. However, the default view in CloudWatch shows the average GPU memory utilization across all instances. Units: Percent |
GPUUtilization |
The percentage of GPU units that are used by the containers on an
instance. The value can range between 0–100 and is multiplied by the number
of GPUs. For example, if there are four GPUs, the For training jobs, the value is the GPU utilization of the algorithm container on the instance. For batch transform jobs, the value is the GPU utilization of the transform container on the instance. NoteFor multi-instance jobs, each instance reports GPU utilization metrics. However, the default view in CloudWatch shows the average GPU utilization across all instances. Units: Percent |
MemoryUtilization |
The percentage of memory that is used by the containers on an instance. This value range is 0%–100%. For processing jobs, the value is the memory utilization of the processing container on the instance.For training jobs, the value is the memory utilization of the algorithm container on the instance. For batch transform jobs, the value is the memory utilization of the transform container on the instance. Units: Percent NoteFor multi-instance jobs, each instance reports memory utilization metrics. However, the default view in CloudWatch shows the average memory utilization across all instances. |
| Dimension | Description |
|---|---|
Host |
For processing jobs, the value for this dimension has the format
For training jobs, the value for this dimension has the format
For batch transform jobs, the value for this dimension has the format
|
SageMaker Inference Recommender jobs metrics
The /aws/sagemaker/InferenceRecommendationsJobs namespace includes the
following metrics for inference recommendation jobs.
| Metric | Description |
|---|---|
ClientInvocations |
The number of Units: None Valid statistics: Sum |
ClientInvocationErrors |
The number of Units: None Valid statistics: Sum |
ClientLatency |
The interval of time taken between sending an Units: Milliseconds Valid statistics: Average, Sum, Min, Max, Sample Count, Percentiles |
NumberOfUsers |
The number of concurrent users sending Units: None Valid statistics: Max, Min, Average |
| Dimension | Description |
|---|---|
JobName |
Filters Inference Recommender job metrics for the specified Inference Recommender job. |
EndpointName |
Filters Inference Recommender job metrics for the specified endpoint. |
SageMaker Ground Truth metrics
| Metric | Description |
|---|---|
ActiveWorkers |
A single active worker on a private work team submitted, released, or declined
a task. To get the total number of active workers, use the Sum statistic. Ground Truth
tries to deliver each individual Units: None Valid statistics: Sum, Sample Count |
DatasetObjectsAutoAnnotated |
The number of dataset objects auto-annotated in a labeling job. This metric is only emitted when automated labeling is enabled. To view the labeling job progress, use the Max metric. Units: None Valid statistics: Max |
DatasetObjectsHumanAnnotated |
The number of dataset objects annotated by a human in a labeling job. To view the labeling job progress, use the Max metric. Units: None Valid statistics: Max |
DatasetObjectsLabelingFailed |
The number of dataset objects that failed labeling in a labeling job. To view the labeling job progress, use the Max metric. Units: None Valid statistics: Max |
JobsFailed |
A single labeling job failed. To get the total number of labeling jobs that failed, use the Sum statistic. Units: None Valid statistics: Sum, Sample Count |
JobsSucceeded |
A single labeling job succeeded. To get the total number of labeling jobs that succeeded, use the Sum statistic. Units: None Valid statistics: Sum, Sample Count |
JobsStopped |
A single labeling jobs was stopped. To get the total number of labeling jobs that were stopped, use the Sum statistic. Units: None Valid statistics: Sum, Sample Count |
TasksAccepted |
A single task was accepted by a worker. To get the total number of tasks
accepted by workers, use the Sum statistic. Ground Truth attempts to deliver each
individual Units: None Valid statistics: Sum, Sample Count |
TasksDeclined |
A single task was declined by a worker. To get the total number of tasks
declined by workers, use the Sum statistic. Ground Truth attempts to deliver each
individual Units: None Valid Statistics: Sum, Sample Count |
TasksReturned |
A single task was returned. To get the total number of tasks returned, use the
Sum statistic. Ground Truth attempts to deliver each individual Units: None Valid statistics: Sum, Sample Count |
TasksSubmitted |
A single task was submitted/completed by a private worker. To get the total
number of tasks submitted by workers, use the Sum statistic. Ground Truth attempts to
deliver each individual Units: None Valid statistics: Sum, Sample Count |
TimeSpent |
Time spent on a task completed by a private worker. This metric does not
include time when a worker paused or took a break. Ground Truth attempts to deliver each
Units: Seconds Valid statistics: Sum, Sample Count |
TotalDatasetObjectsLabeled |
The number of dataset objects labeled successfully in a labeling job. To view the labeling job progress, use the Max metric. Units: None Valid statistics: Max |
| Dimension | Description |
|---|---|
LabelingJobName |
Filters dataset object count metrics for a labeling job. |
Amazon SageMaker Feature Store metrics
| Metric | Description |
|---|---|
ConsumedReadRequestsUnits |
The number of consumed read units over the specified time period. You can retrieve the consumed read units for a feature store runtime operation and its corresponding feature group. Units: None Valid statistics: All |
ConsumedWriteRequestsUnits |
The number of consumed write units over the specified time period. You can retrieve the consumed write units for a feature store runtime operation and its corresponding feature group. Units: None Valid statistics: All |
ConsumedReadCapacityUnits |
The number of provisioned read capacity units consumed over the specified time period. You can retrieve the consumed read capacity units for a feature store runtime operation and its corresponding feature group. Units: None Valid statistics: All |
ConsumedWriteCapacityUnits |
The number of provisioned write capacity units consumed over the specified time period. You can retrieve the consumed write capacity units for a feature store runtime operation and its corresponding feature group. Units: None Valid statistics: All |
| Dimension | Description |
|---|---|
FeatureGroupName, OperationName |
Filters feature store runtime consumption metrics of the feature group and the operation that you've specified. |
| Metric | Description |
|---|---|
Invocations |
The number of requests made to the feature store runtime operations over the specified time period. Units: None Valid statistics: Sum |
Operation4XXErrors |
The number of requests made to the Feature Store runtime operations where the operation returned a 4xx HTTP response code. For each 4xx response, 1 is sent; else, 0 is sent. Units: None Valid statistics: Average, Sum |
Operation5XXErrors |
The number of requests made to the feature store runtime operations where the operation returned a 5xx HTTP response code. For each 5xx response, 1 is sent; else, 0 is sent. Units: None Valid statistics: Average, Sum |
ThrottledRequests |
The number of requests made to the feature store runtime operations where the request got throttled. For each throttled request, 1 is sent; else, 0 is sent. Units: None Valid statistics: Average, Sum |
Latency |
The time interval to process requests made to the Feature Store runtime operations. This interval is measured from the time SageMaker AI receives the request until it returns a response to the client. Units: Microseconds Valid statistics: Average, Sum, Min, Max, Sample Count, Percentiles |
| Dimension | Description |
|---|---|
|
|
Filters feature store runtime operational metrics of the feature group and the operation that you've specified. You can use these dimensions for non batch operations, such as GetRecord, PutRecord, DeleteRecord, and ListRecords. |
OperationName |
Filters feature store runtime operational metrics for the operation that you've specified. You can use this dimension for batch operations such as BatchGetRecord and BatchWriteRecord. |
SageMaker pipelines metrics
The AWS/Sagemaker/ModelBuildingPipeline namespace includes the following
metrics for pipeline executions.
Two categories of pipeline execution metrics are available:
-
Execution Metrics across All Pipelines – Account level pipeline execution metrics (for all pipelines in the current account)
-
Execution Metrics by Pipeline – Pipeline execution metrics per pipeline
Metrics are available at a 1-minute frequency.
| Metric | Description |
|---|---|
ExecutionStarted |
The number of pipeline executions that started. Units: Count Valid statistics: Average, Sum |
ExecutionFailed |
The number of pipeline executions that failed. Units: Count Valid statistics: Average, Sum |
ExecutionSucceeded |
The number of pipeline executions that succeeded. Units: Count Valid statistics: Average, Sum |
ExecutionStopped |
The number of pipeline executions that stopped. Units: Count Valid statistics: Average, Sum |
ExecutionDuration |
The duration in milliseconds that the pipeline execution ran. Units: Milliseconds Valid statistics: Average, Sum, Min, Max, Sample Count |
| Dimension | Description |
|---|---|
PipelineName |
Filters pipeline execution metrics for a specified pipeline. |
The AWS/Sagemaker/ModelBuildingPipeline namespace includes the following
metrics for pipeline steps.
Metrics are available at a 1-minute frequency.
| Metric | Description |
|---|---|
StepStarted |
The number of steps that started. Units: Count Valid statistics: Average, Sum |
StepFailed |
The number of steps that failed. Units: Count Valid statistics: Average, Sum |
StepSucceeded |
The number of steps that succeeded. Units: Count Valid statistics: Average, Sum |
StepStopped |
The number of steps that stopped. Units: Count Valid statistics: Average, Sum |
StepDuration |
The duration in milliseconds that the step ran. Units: Milliseconds Valid statistics: Average, Sum, Min, Max, Sample Count |
| Dimension | Description |
|---|---|
PipelineName, StepName |
Filters step metrics for a specified pipeline and step. |