Troubleshoot Inference Pipelines
To troubleshoot inference pipeline issues, use CloudWatch logs and error messages. If you are using custom Docker images in a pipeline that includes Amazon SageMaker AI built-in algorithms, you might also encounter permissions problems. To grant the required permissions, create an Amazon Elastic Container Registry (Amazon ECR) policy.
Topics
Troubleshoot Amazon ECR Permissions for Inference Pipelines
When you use custom Docker images in a pipeline that includes SageMaker AI built-in algorithms
Use CloudWatch Logs to Troubleshoot SageMaker AI Inference Pipelines
SageMaker AI publishes the container logs for endpoints that deploy an inference pipeline to Amazon CloudWatch at the following path for each container.
/aws/sagemaker/Endpoints/{EndpointName}/{Variant}/{InstanceId}/{ContainerHostname}
For example, logs for this endpoint are published to the following log groups and streams:
EndpointName: MyInferencePipelinesEndpoint
Variant: MyInferencePipelinesVariant
InstanceId: i-0179208609ff7e488
ContainerHostname: MyContainerName1 and MyContainerName2
logGroup: /aws/sagemaker/Endpoints/MyInferencePipelinesEndpoint
logStream: MyInferencePipelinesVariant/i-0179208609ff7e488/MyContainerName1
logStream: MyInferencePipelinesVariant/i-0179208609ff7e488/MyContainerName2
A log stream is a sequence of log events that share the same source. Each separate source of logs into CloudWatch makes up a separate log stream. A log group is a group of log streams that share the same retention, monitoring, and access control settings.
To see the log groups and streams
Open the CloudWatch console at https://console.amazonaws.cn/cloudwatch/
. -
In the navigation page, choose Logs.
-
In Log Groups. filter on
MyInferencePipelinesEndpoint:
-
To see the log streams, on the CloudWatch Log Groups page, choose
MyInferencePipelinesEndpoint, and then Search Log Group.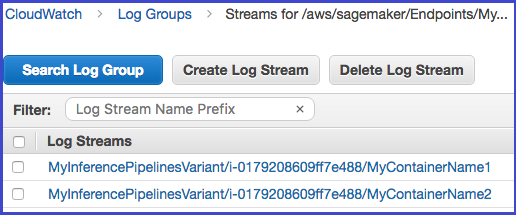
For a list of the logs that SageMaker AI publishes, see Inference Pipeline Logs and Metrics.
Use Error Messages to Troubleshoot Inference Pipelines
The inference pipeline error messages indicate which containers failed.
If an error occurs while SageMaker AI is invoking an endpoint, the service returns a
ModelError (error code 424), which indicates which container
failed. If the request payload (the response from the previous container) exceeds
the limit of 5 MB, SageMaker AI provides a detailed error message, such as:
Received response from MyContainerName1 with status code 200. However,
                    the request payload from MyContainerName1 to MyContainerName2 is 6000000 bytes,
                    which has exceeded the maximum limit of 5 MB.
If a container fails the ping health check while SageMaker AI is creating an endpoint, it
returns a ClientError and indicates all of the containers that failed
the ping check in the last health check.