Recommendation results
Each Inference Recommender job result includes InstanceType,
InitialInstanceCount, and EnvironmentParameters, which
are tuned environment variable parameters for your container to improve its latency
and throughput. The results also include performance and cost metrics such as
MaxInvocations, ModelLatency,
CostPerHour, CostPerInference,
CpuUtilization, and MemoryUtilization.
In the table below we provide a description of these metrics. These metrics can
help you narrow down your search for the best endpoint configuration that suits your
use case. For example, if your motivation is overall price performance with an
emphasis on throughput, then you should focus on CostPerInference.
| Metric | Description | Use case |
|---|---|---|
|
|
The interval of time taken by a model to respond as viewed from SageMaker AI. This interval includes the local communication times taken to send the request and to fetch the response from the container of a model and the time taken to complete the inference in the container. Units: Milliseconds |
Latency sensitive workloads such as ad serving and medical diagnosis |
|
|
The maximum number of Units: None |
Throughput-focused workloads such as video processing or batch inference |
|
|
The estimated cost per hour for your real-time endpoint. Units: US Dollars |
Cost sensitive workloads with no latency deadlines |
|
|
The estimated cost per inference call for your real-time endpoint. Units: US Dollars |
Maximize overall price performance with a focus on throughput |
|
|
The expected CPU utilization at maximum invocations per minute for the endpoint instance. Units: Percent |
Understand instance health during benchmarking by having visibility into core CPU utilization of the instance |
|
|
The expected memory utilization at maximum invocations per minute for the endpoint instance. Units: Percent |
Understand instance health during benchmarking by having visibility into core memory utilization of the instance |
In some cases you might want to explore other SageMaker AI Endpoint Invocation metrics such as CPUUtilization.
Every Inference Recommender job result includes the names of endpoints spun up during the load
test. You can use CloudWatch to review the logs for these endpoints even after they’ve
been deleted.
The following image is an example of CloudWatch metrics and charts you can review for a
single endpoint from your recommendation result. This recommendation result is from
a Default job. The way to interpret the scalar values from the recommendation
results is that they are based on the time point when the Invocations graph first
begins to level out. For example, the ModelLatency value reported is at
the beginning of the plateau around 03:00:31.
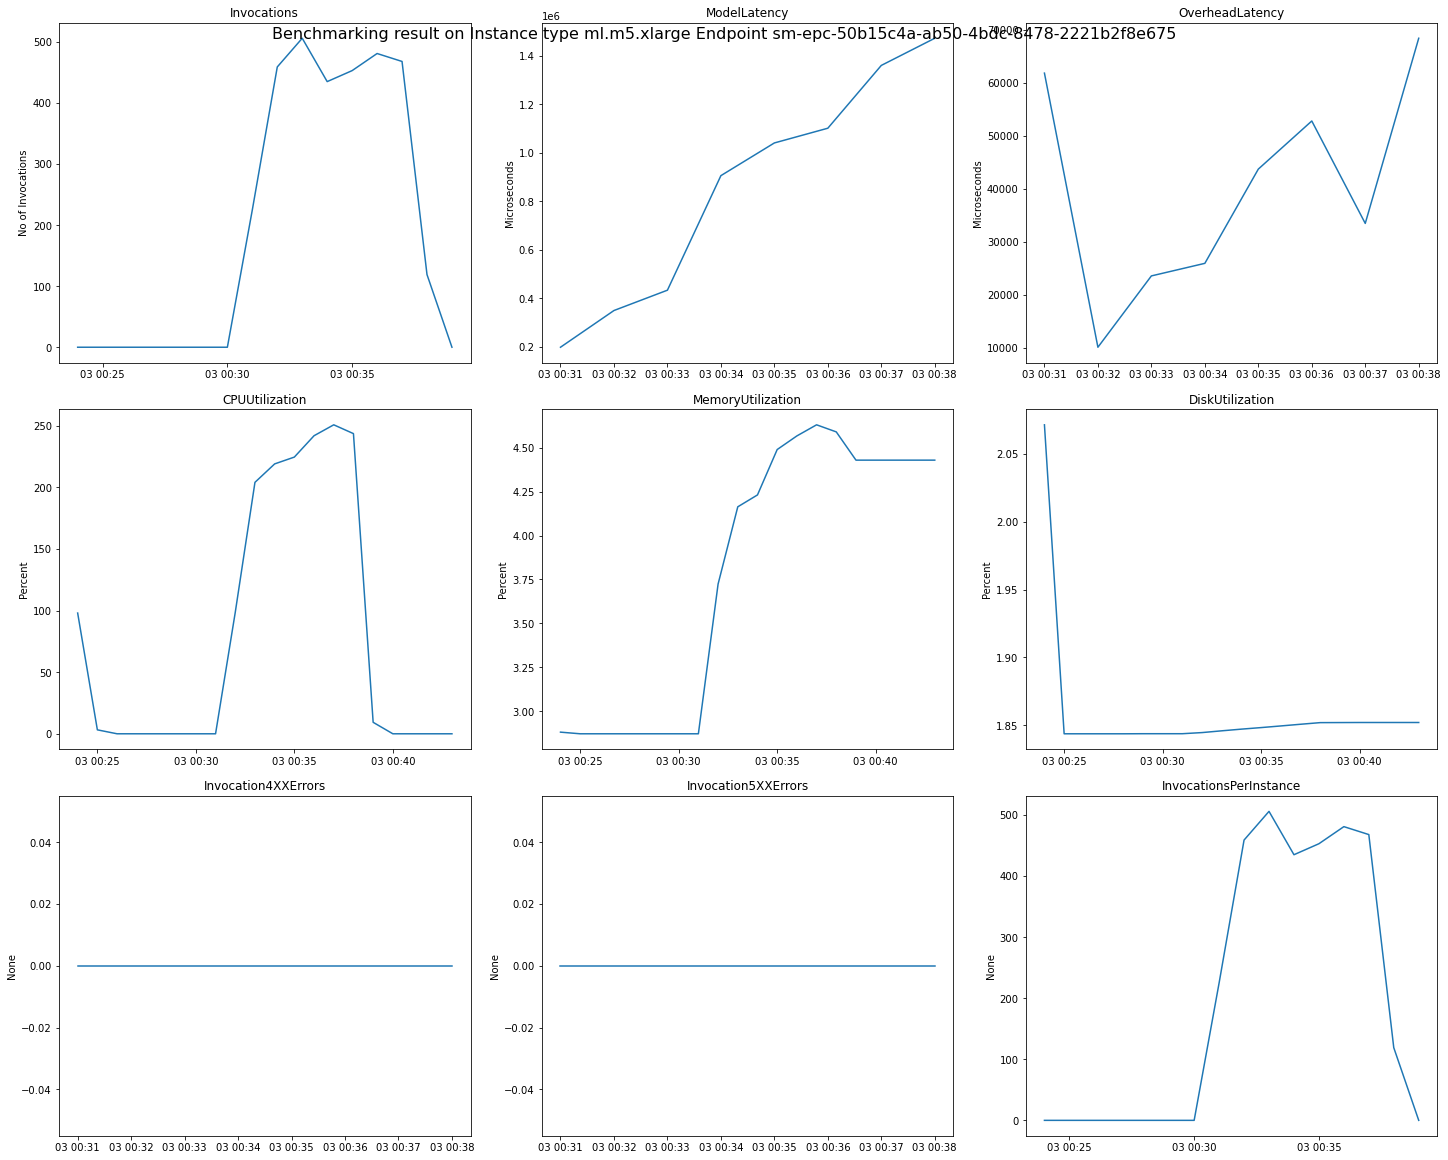
For full descriptions of the CloudWatch metrics used in the preceding charts, see SageMaker AI Endpoint Invocation metrics.
You can also see performance metrics like ClientInvocations and
NumberOfUsers published by Inference Recommender in the
/aws/sagemaker/InferenceRecommendationsJobs namespace. For a full
list of metrics and descriptions published by Inference Recommender, see SageMaker Inference Recommender jobs metrics.
See the Amazon SageMaker Inference Recommender - CloudWatch Metrics