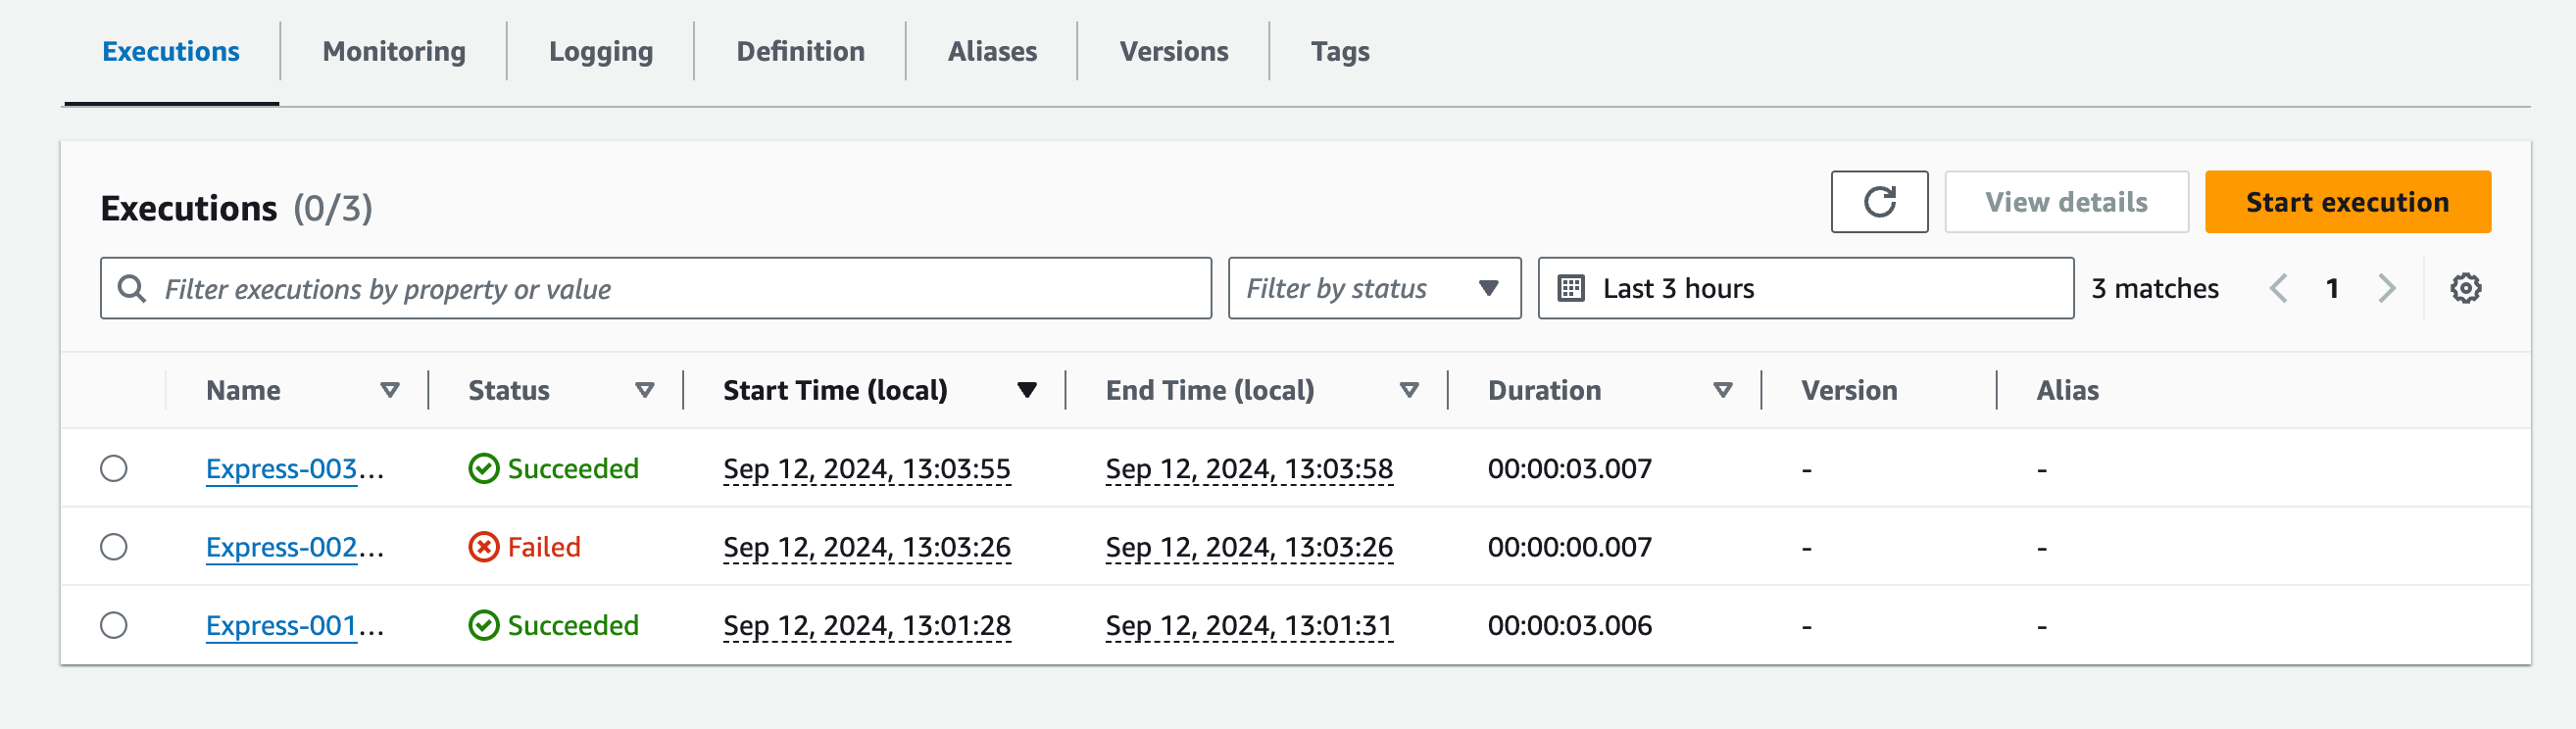
Viewing execution details in the Step Functions console
You can view in-progress and past executions of workflows in the Executions section of the Step Functions console.
In the Executions details, you can view the state machine’s definition, execution status, ARN, number of state transitions, and the inputs and outputs for individual states in the workflow.
Standard workflow execution details are recorded in Step Functions, but the history of Express workflow executions are not. To record Express workflow executions, you must configure your Express state machines to send logs to Amazon CloudWatch. See Logging in CloudWatch Logs to set up logging for Step Functions.
The console experience to view both types of workflow executions is similar, but there are some limitations for Express workflows. See Standard and Express console experience differences.
Note
Because execution data for Express workflows are displayed using CloudWatch Logs Insights, scanning the logs will incur charges. By default, your log group only lists executions completed in
the last three hours. If you specify a larger time range that includes more execution events, your costs will increase. For more information, see Vended Logs
under the Logs tab on the CloudWatch Pricing page
Execution details overview
The execution details link and page title use the unique execution ID generated by Step Functions or the custom ID you provided when starting the workflow. The Execution Details page includes metrics and the following options to manage your state machine:
-
Stop execution – Stop an in-progress execution. (Unavailable for completed executions.)
-
Start new execution – Start a new execution of your state machine
-
Redrive – Redrive executions of Standard Workflows that did not complete successfully in the last 14 days, including failed, aborted, or timed out executions. For more information, see Redriving state machines.
-
Export – Export the execution details in JSON format to share or perform offline analysis.
Viewing executions started with a version or alias
You can also view the executions started with a version or an alias in the Step Functions console. For more information, see Listing executions for versions and aliases.
The Execution Details console page contains the following sections:
Execution summary
The Execution summary provides an overview of the execution details of your workflow, in the following tabs:
- Details
-
Shows information, such as the execution's status, ARN, and timestamps for execution start and end time. You can also view the total count of State transitions that occurred while running the state machine execution. You can also view the links for X-Ray trace map and Amazon CloudWatch Execution Logs if you enabled tracing or logs for your state machine.
If your state machine execution was started by another state machine, you can view the link for the parent state machine on this tab.
If your state machine execution was redriven, this tab displays redrive related information, for example Redrive count.
- Execution input and output
-
Shows the state machine execution input and output side-by-side.
- Definition
-
Shows the state machine's Amazon States Language definition.
Error message
If your state machine execution failed, the Execution Details page displays an error message. Choose Cause or View step details in the error message to view the reason for execution failure or the step that caused the error.
If you choose View step details, Step Functions highlights the step that caused the error in the Step details, Graph view, and Table view tabs. If the step is a Task, Map, or Parallel state for which you've defined retries, the Step details pane displays the Retry tab for the step. Additionally, if you've redriven the execution, you can see the retries and redrive execution details in the Retries & redrives tab of the Step details pane.
From the Recover dropdown button on this error message, you can either redrive your unsuccessful executions or start a new execution. For more information, see Redriving state machines.
The error message for a failed state machine execution will be displayed on the Execution Details page. The error message will also have a link to the step that caused the execution failure.
View mode
The View mode section contains two different visualizations for your state machine. You can choose to view a graphic representation of the workflow, a table outlining the states in your workflow, or a list of the events associated with your state machine's execution:
Graph view
The Graph view mode displays a graphical representation of your workflow. A legend is included at the bottom that indicates the execution status of the state machine. It also contains buttons that let you zoom in, zoom out, center align the full workflow, or view the workflow in full-screen mode.
From the graph view, you can choose any step in your workflow to view details about its execution in the Step details component. When you chose a step in the Graph view, the Table view also shows that step. This is true in reverse as well. If you choose a step from Table view, the Graph view shows the same step.
If your state machine contains a Map state,
Parallel state, or both, you can view their names in the
workflow in the Graph view. In addition, for the
Map state, the Graph view lets you
move across different iterations of the Map state
execution data. For example, if your Map state has
five iterations and you want to view the execution data for the third
and fourth iterations, do the following:
-
Choose the Map state whose iteration data you want to view.
-
From Map iteration viewer, choose #2 from the dropdown list for third iteration. This is because iterations are counted from zero. Likewise, choose #3 from the dropdown list for the fourth iteration of the Map state.
Alternatively, use the up arrow icon and down arrow icon controls to move between different iterations of the Map state.
Note
If your state machine contains nested
Mapstates, the dropdown lists for the parent and childMapstate iterations will be displayed to represent the iteration data. -
(Optional) If one or more of your Map state iterations failed to execute, or the execution was stopped, you can view its data by choosing those iteration numbers under Failed or Aborted in the dropdown list.
Finally, you can use the Export and Layout buttons to export the workflow graph as an SVG or PNG image. You can also switch between horizontal and vertical views of your workflow.
Table view
The Table view mode displays a tabular representation of the states in your workflow. In this View mode, you can see the details of each state that was executed in your workflow, including its name, the name of any resource it used (such as an Amazon Lambda function), and if the state executed successfully.
From this view, you can choose any state in your workflow to view details about its execution in the Step details component. When you chose a step in the Table view, the Graph view also shows that step. This is true in reverse as well. If you choose a step from Graph view, the Table view shows the same step.
You can also limit the amount of data displayed in the Table view mode by applying filters to the view. You can create a filter for a specific property, such as Status or Redrive attempt. For more information, see Examine executions.
By default, this mode displays the Name, Type, Status, Resource, and Started After columns. You can configure the columns you want to view using the Preferences dialog box. The selections that you make on this dialog box persist for future state machine executions until they are changed again.
If you add the Timeline column, the execution duration of each state is shown with respect to the runtime for the entire execution. This is displayed as a color-coded, linear timeline. This can help you identify any performance-related issues with a specific state's execution. The color-coded segments for each state on the timeline help you identify the state's execution status, such as in-progress, failed, or aborted.
For example, if you've defined execution retries for a state in your state machine, these retries are shown in the timeline. Red segments represent the failed
Retry attempts, while light gray segments represent the BackoffRate between each Retry attempt.
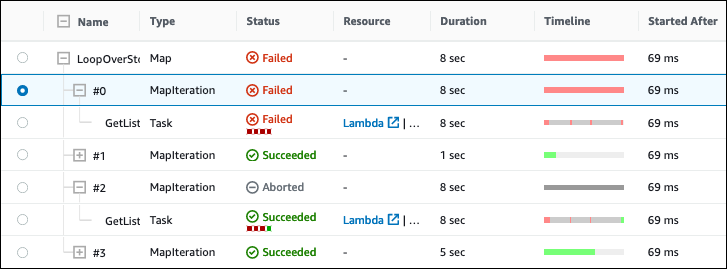
If your state machine contains a Map state,
Parallel state, or both, you can view their names in
the workflow in Table view. For Map and
Parallel states, the Table view
mode displays the execution data for their iterations and parallel
branches as nodes inside a tree view. You can choose each node in these
states to view their individual details in the Step
details section. For example, you can review the
data for a specific Map state iteration that caused
the state to fail. Expand the node for the Map
state, and then view the status for each iteration in the
Status column.
Step details
The Step details section opens up on the right when you choose a state in the Graph view or Table view. This section contains the following tabs, which provide you in-depth information about the selected state:
- Input
-
Shows the input details of the selected state. If there is an error in the input, it is indicated with a error icon on the tab header. In addition, you can view the reason for the error in this tab.
You can also choose the Advanced view toggle button to see the input data transfer path as the data passed through the selected state. This lets you identify how your input was processed as one or more of the fields, such as
InputPath,Parameters,ResultSelector,OutputPath, andResultPath, were applied to the data. - Output
-
Shows the output of the selected state. If there is an error in the output, it is indicated with an error icon on the tab header. In addition, you can view the reason for the error in the this tab.
You can also choose the Advanced view toggle button to see the output data transfer path as the data passed through the selected state. This lets you identify how your input was processed as one or more of the fields, such as
InputPath,Parameters,ResultSelector,OutputPath, andResultPath, were applied to the data. - Details
-
Shows information, such as the state type, its execution status, and execution duration.
For
Taskstates that use a resource, such as Amazon Lambda, this tab provides links to the resource definition page and Amazon CloudWatch logs page for the resource invocation. It also shows values, if specified, for theTaskstate'sTimeoutSecondsandHeartbeatSecondsfields.For
Mapstates, this tab shows you information regarding the total count of aMapstate's iterations. Iterations are categorized as Failed, Aborted, Succeeded, or InProgress. - Definition
-
Shows the Amazon States Language definition corresponding to the selected state.
- Retry
-
Note
This tab appears only if you have defined a
Retryfield in your state machine'sTaskorParallelstate.Shows the initial and subsequent retry attempts for a selected state in its original execution attempt. For the initial and all the subsequent failed attempts, choose the arrow icon next to Type to view the Reason for failure that appears in a dropdown box. If the retry attempt succeeds, you can view the Output that appears in a dropdown box.
If you've redriven your execution, this tab header displays the name Retries & redrives and displays the retry attempt details for each redrive.
- Events
-
Shows a filtered list of the events associated with the selected state in an execution. The information you see on this tab is a subset of the complete execution event history you see in the Events table.
Events
The Events table displays the complete history for the selected execution as a list of events spanning multiple pages. Each page contains up to 25 events. This section also displays the total event count, which can help you determine if you exceeded the maximum event history count of 25,000 events.
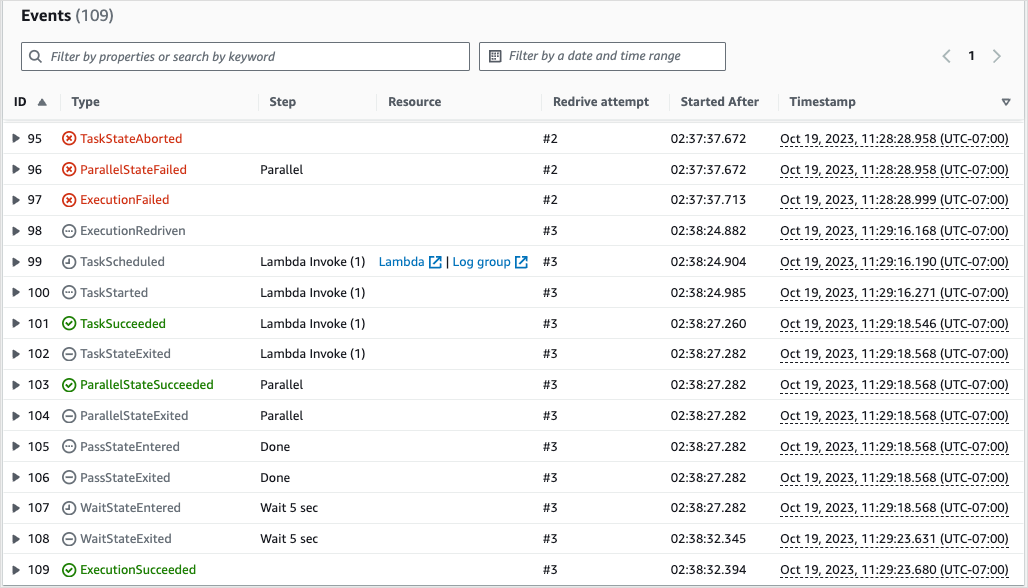
By default, the results in the Events table are displayed in ascending order based on the Timestamp of the events. You can change the execution event history's sorting to descending order by clicking on the Timestamp column header.
In the Events table, each event is color-coded to indicate its execution status. For example, events that failed appear in red. To view additional details about an event, choose the arrow icon next to the event ID. Once open, the event details show the input, output, and resource invocation for the event.
In addition, in the Events table, you can apply filters to limit the execution event history results that are displayed. You can choose properties such as ID, or Redrive attempt. For more information, see Examine executions.
Standard and Express console experience differences
Standard workflows
The execution histories for Standard Workflows are always available for executions completed in the last 90 days.
Express workflows
For Express workflows, the Step Functions console retrieves log data gathered through a
CloudWatch Logs log group to show execution history. The histories for executions completed in
the last three hours are available by default. You
can customize the time range. If you specify a larger time range which includes more
execution events, the cost to scan the logs will increase. For more information, see
Vended Logs under the Logs tab on the
CloudWatch Pricing page
Considerations and limitations for viewing Express workflow executions
When viewing Express workflow executions on the Step Functions console, keep in mind the following considerations and limitations:
Availability of Express workflow execution details relies on Amazon CloudWatch Logs
For Express workflows, their execution history and detailed execution information are gathered through CloudWatch Logs Insights. This information is kept in the CloudWatch Logs log group that you specify when you create the state machine. The state machine's execution history is shown under the Executions tab on the Step Functions console.
Warning
If you delete the CloudWatch Logs for an Express workflow, it won't be listed under the Executions tab.
We recommend that you use the default log level of ALL for logging all execution event types. You can update the log level as required for your existing state machines when you edit them. For more information, see Using CloudWatch Logs to log execution history in Step Functions and Event log levels.
Partial Express workflow execution details are available if logging level is ERROR or FATAL
By default, the logging level for Express workflow executions is set to ALL. If you change the log level, the execution histories and execution details for completed executions won’t be affected. However, all new executions will emit logs based on the updated log level. For more information, see Using CloudWatch Logs to log execution history in Step Functions and Event log levels.
For example, if you change the log level from ALL to either ERROR or FATAL, the Executions tab on the Step Functions console only lists failed executions. In the Event view tab, the console shows only the event details for the state machine steps that failed.
We recommend that you use the default log level of ALL for logging all execution event types. You can update the log level as required for your existing state machines when you edit the state machine.
State machine definition for a prior execution can't be viewed after the state machine has been modified
State machine definitions for past executions are not stored for Express workflows. If you change your state machine definition, you can only view the state machine definition for executions using the most current definition.
For example, if you remove one or more steps from your state machine definition, Step Functions detects a mismatch between the definition and prior execution events. Because previous definitions are not stored for Express workflows, Step Functions can't display the state machine definition for executions run on an earlier version of the state machine definition. As a result, the Definition, Graph view, and Table view tabs are unavailable for executions run on previous versions of a state machine definition.