Services or capabilities described in Amazon Web Services documentation might vary by Region. To see the differences applicable to the China Regions,
see Getting Started with Amazon Web Services in China
(PDF).
Migrate to OpenTelemetry .NET
When using X-Ray Tracing in your .NET applications, the X-Ray .NET SDK with manual efforts is used for instrumentation.
This section provides code examples in the Manual instrumentation solutions with the SDK section for migrating from the X-Ray manual instrumentation solution to OpenTelemetry manual Instrumentation solutions for .NET. Alternatively,
you can migrate from X-Ray manual instrumentation to OpenTelemetry automatic instrumentation solutions to instrument .NET applications without having to modify application source code in the
Zero code automatic instrumentation solutions section.
Zero code automatic instrumentation solutions
OpenTelemetry provides zero-code auto-instrumentation solutions. These solutions trace requests without requiring changes to your application code.
OpenTelemetry-based automatic instrumentation options
Manual instrumentation solutions with the SDK
- Tracing configuration with X-Ray SDK
-
For .NET web applications, the X-Ray SDK is configured in the appSettings section of the Web.config file.
Example Web.config
<configuration>
  <appSettings>
    <add key="AWSXRayPlugins" value="EC2Plugin"/>
  </appSettings>
</configuration>
For .NET Core, a file named appsettings.json with a top-level key named XRay is used, and then a configuration object is built o initialize the X-Ray recorder.
Example for .NET appsettings.json
{
  "XRay": {
    "AWSXRayPlugins": "EC2Plugin"
  }
}
Example for .NET Core Program.cs – Recorder configuration
using Amazon.XRay.Recorder.Core;
...
AWSXRayRecorder.InitializeInstance(configuration);
- Tracing configuration with OpenTelemetry SDK
-
Add these dependencies:
dotnet add package OpenTelemetry
dotnet add package OpenTelemetry.Contrib.Extensions.AWSXRay
dotnet add package OpenTelemetry.Sampler.AWS --prerelease
dotnet add package OpenTelemetry.Resources.AWS
dotnet add package OpenTelemetry.Exporter.OpenTelemetryProtocol
dotnet add package OpenTelemetry.Extensions.Hosting
dotnet add package OpenTelemetry.Instrumentation.AspNetCore
For your .NET application, configure the OpenTelemetry SDK by setting up the Global TracerProvider. The following example configuration also enables
instrumentation for ASP.NET Core. To instrument ASP.NET, see Tracing incoming requests (ASP.NET and ASP.NET core instrumentation). To use
OpenTelemetry with other frameworks, see Registry
for more libraries for
supported frameworks.
It is recommend that you configure the following components:
using OpenTelemetry;
using OpenTelemetry.Contrib.Extensions.AWSXRay.Trace;
using OpenTelemetry.Sampler.AWS;
using OpenTelemetry.Trace;
using OpenTelemetry.Resources;

var builder = WebApplication.CreateBuilder(args);

var serviceName = "MyServiceName";
var serviceVersion = "1.0.0";

var resourceBuilder = ResourceBuilder
    .CreateDefault()
    .AddService(serviceName: serviceName)
    .AddAWSEC2Detector();

builder.Services.AddOpenTelemetry()
    .ConfigureResource(resource => resource
        .AddAWSEC2Detector()
        .AddService(
            serviceName: serviceName,
            serviceVersion: serviceVersion))
    .WithTracing(tracing => tracing
        .AddSource(serviceName)
        .AddAspNetCoreInstrumentation()
        .AddOtlpExporter()
        .SetSampler(AWSXRayRemoteSampler.Builder(resourceBuilder.Build())
            .SetEndpoint("http://localhost:2000")
            .Build()));

Sdk.SetDefaultTextMapPropagator(new AWSXRayPropagator()); // configure  X-Ray propagator
To use OpenTelemetry for a console app, add the following OpenTelemetry configuration at the startup of your program.
using OpenTelemetry;
using OpenTelemetry.Contrib.Extensions.AWSXRay.Trace;
using OpenTelemetry.Trace;
using OpenTelemetry.Resources;

var serviceName = "MyServiceName";

var resourceBuilder = ResourceBuilder
    .CreateDefault()
    .AddService(serviceName: serviceName)
    .AddAWSEC2Detector();

var tracerProvider = Sdk.CreateTracerProviderBuilder()
    .AddSource(serviceName)
    .ConfigureResource(resource =>
        resource
            .AddAWSEC2Detector()
            .AddService(
                serviceName: serviceName,
                serviceVersion: serviceVersion
            )
        )
    .AddOtlpExporter() // default address localhost:4317
    .SetSampler(new TraceIdRatioBasedSampler(1.00))
    .Build();

Sdk.SetDefaultTextMapPropagator(new AWSXRayPropagator()); // configure  X-Ray propagator
Manually creating trace data
- With X-Ray SDK
-
With the X-Ray SDK, the BeginSegment and BeginSubsegment methods were needed to manually create X-Ray segments and sub-segments.
using Amazon.XRay.Recorder.Core;

AWSXRayRecorder.Instance.BeginSegment("segment name"); // generates `TraceId` for you
try
{
    // Do something here
    // can create custom subsegments
    AWSXRayRecorder.Instance.BeginSubsegment("subsegment name");
    try
    {
        DoSometing();
    }
    catch (Exception e)
    {
        AWSXRayRecorder.Instance.AddException(e);
    }
    finally
    {
        AWSXRayRecorder.Instance.EndSubsegment();
    }
}
catch (Exception e)
{
    AWSXRayRecorder.Instance.AddException(e);
}
finally
{
    AWSXRayRecorder.Instance.EndSegment();
}
- With OpenTelemetry SDK
-
In .NET, you can use the activity API to create custom spans to monitor the performance of internal activities that are not captured by instrumentation
libraries. Note that only spans of kind Server are converted into X-Ray segments, all other spans are converted into X-Ray sub-egments.
You can create as many ActivitySource instances as needed, but it is recommended to have only one for an entire application/service.
using System.Diagnostics;

ActivitySource activitySource = new ActivitySource("ActivitySourceName", "ActivitySourceVersion");


...


using (var activity = activitySource.StartActivity("ActivityName", ActivityKind.Server)) // this will be translated to a X-Ray Segment
{
    // Do something here

    using (var internalActivity = activitySource.StartActivity("ActivityName", ActivityKind.Internal)) // this will be translated to an X-Ray Subsegment
    {
        // Do something here
    }
}
Adding annotations and metadata to traces with OpenTelemetry SDK
You can also add custom key-value pairs as attributes onto your spans by using the SetTag method on an activity. Note that by default, all the span attributes
will be converted into metadata in X-Ray raw data. To ensure that an attribute is converted into an annotation and not metadata, you can add that attribute's key to the list of aws.xray.annotations attribute.
using (var activity = activitySource.StartActivity("ActivityName", ActivityKind.Server)) // this will be translated to a X-Ray Segment
{
    activity.SetTag("metadataKey", "metadataValue");
    activity.SetTag("annotationKey", "annotationValue");
    string[] annotationKeys = {"annotationKey"};
    activity.SetTag("aws.xray.annotations", annotationKeys);

    // Do something here

    using (var internalActivity = activitySource.StartActivity("ActivityName", ActivityKind.Internal)) // this will be translated to an X-Ray Subsegment
    {
        // Do something here
    }
}
With OpenTelemetry automatic instrumentation
If you are using an OpenTelemetry automatic instrumentation solution for .NET, and if you need to perform manual instrumentation in your application,
for example, to instrument code within the application itself for sections that are not covered by any auto-instrumentation library.
Since there can only be one global TracerProvider, manual instrumentation should not instantiate its own TracerProvider if used together alongside auto-instrumentation.
When TracerProvider is used, custom manual tracing works the same way when using automatic instrumentation or manual instrumentation through the OpenTelemetry SDK.
Tracing incoming requests (ASP.NET and ASP.NET core instrumentation)
- With X-Ray SDK
-
To instrument requests served by the ASP.NET application, see https://docs.amazonaws.cn/xray/latest/devguide/xray-sdk-dotnet-messagehandler.html for information on how to
call RegisterXRay in the Init method of your global.asax file.
AWSXRayASPNET.RegisterXRay(this, "MyApp");
To instrument requests served by your ASP.NET core application, the UseXRay method is called before any other middleware in the Configure method of your Startup class.
app.UseXRay("MyApp");
- With OpenTelemetry SDK
OpenTelemetry also provides instrumentation libraries to collect traces for incoming web requests for ASP.NET and ASP.NET core. The following section lists the
steps needed to add and enable these library instrumentations for your OpenTelemetry configuration, including how to add ASP.NET or ASP.NET core instrumentation when creating the
Tracer Provider.
For information on how to enable OpenTelemetry.Instrumentation.AspNet, see Steps to enable OpenTelemetry.Instrumentation.AspNet
and for information on how to enable OpenTelemetry.Instrumentation.AspNetCore, see Steps to enable OpenTelemetry.Instrumentation.AspNetCore
.
Amazon SDK instrumentation
- With X-Ray SDK
-
Install all Amazon SDK clients by calling RegisterXRayForAllServices().
using Amazon.XRay.Recorder.Handlers.AwsSdk;
AWSSDKHandler.RegisterXRayForAllServices(); //place this before any instantiation of AmazonServiceClient
AmazonDynamoDBClient client = new AmazonDynamoDBClient(RegionEndpoint.USWest2); // AmazonDynamoDBClient is automatically registered with X-Ray
Use one of the following methods for specific Amazon service client instrumentation.
AWSSDKHandler.RegisterXRay<IAmazonDynamoDB>(); // Registers specific type of AmazonServiceClient : All instances of IAmazonDynamoDB created after this line are registered
AWSSDKHandler.RegisterXRayManifest(String path); // To configure custom Amazon Service Manifest file. This is optional, if you have followed "Configuration" section
- With OpenTelemetry SDK
For the following code example, you will need the following dependency:
dotnet add package OpenTelemetry.Instrumentation.AWS
To instrument the Amazon SDK, update the OpenTelemetry SDK configuration where the Global TracerProvider is setup.
builder.Services.AddOpenTelemetry()
    ...
    .WithTracing(tracing => tracing
        .AddAWSInstrumentation()
        ...
Instrumenting outgoing HTTP calls
- With X-Ray SDK
-
The X-Ray .NET SDK traces outgoing HTTP calls through the extension methods GetResponseTraced() or GetAsyncResponseTraced()
when using System.Net.HttpWebRequest, or by using the HttpClientXRayTracingHandler handler when using System.Net.Http.HttpClient.
- With OpenTelemetry SDK
-
For the following code example, you will need the following dependency:
dotnet add package OpenTelemetry.Instrumentation.Http
To instrument System.Net.Http.HttpClient and System.Net.HttpWebRequest, update the OpenTelemetry SDK configuration where the Global TracerProvider is setup.
builder.Services.AddOpenTelemetry()
    ...
    .WithTracing(tracing => tracing
        .AddHttpClientInstrumentation()
        ...
Instrumentation support for other libraries
You can search and filter the OpenTelemetry Registry for .NET Instrumentation Libraries to find out if OpenTelemetry supports instrumentation for your Library. See the Registry
to start searching.
Lambda instrumentation
- With X-Ray SDK
-
The following procedure was required to use the X-Ray SDK with Lambda:
-
Enable Active Tracing on your Lambda function
-
The Lambda service creates a segment that represents your handler's invocation
-
Create sub-segments or instrument libraries using the X-Ray SDK
- With OpenTelemetry-based solutions
-
You can automatically instrument your Lambda with Amazon vended Lambda layers. There are two solutions:
-
(Recommended) Amazon Lambda Layer for OpenTelemetry
-
For better performance, you may want to consider using OpenTelemetry Manual Instrumentation to generate OpenTelemetry traces for your Lambda function.
OpenTelemetry manual instrumentation for Amazon Lambda
The following is the Lambda function code (without instrumentation) example.
using System;
using System.Text;
using System.Threading.Tasks;
using Amazon.Lambda.Core;
using Amazon.S3;
using Amazon.S3.Model;

// Assembly attribute to enable Lambda function logging
[assembly: LambdaSerializer(typeof(Amazon.Lambda.Serialization.SystemTextJson.DefaultLambdaJsonSerializer))]

namespace ExampleLambda;

public class ListBucketsHandler
{
    private static readonly AmazonS3Client s3Client = new();

    // new Lambda function handler passed in
    public async Task<string> HandleRequest(object input, ILambdaContext context)
    {
        try
        {
            var DoListBucketsAsyncResponse = await DoListBucketsAsync();
            context.Logger.LogInformation($"Results: {DoListBucketsAsyncResponse.Buckets}");

            context.Logger.LogInformation($"Successfully called ListBucketsAsync");
            return "Success!";
        }
        catch (Exception ex)
        {
            context.Logger.LogError($"Failed to call ListBucketsAsync: {ex.Message}");
            throw;
        }
    }

    private async Task<ListBucketsResponse> DoListBucketsAsync()
    {
        try
        {
            var putRequest = new ListBucketsRequest
            {
            };

            var response = await s3Client.ListBucketsAsync(putRequest);
            return response;
        }
        catch (AmazonS3Exception ex)
        {
            throw new Exception($"Failed to call ListBucketsAsync: {ex.Message}", ex);
        }
    }
}
To manually instrument your Lambda handler and the Amazon S3 client, do the following.
-
Instantiate a TracerProvider – The TracerProvider is recommended to be configured with an XrayUdpSpanExporter, a ParentBased Always On Sampler, and a Resource with service.name
set to the Lambda function name.
-
Instrument the Amazon S3 client with the OpenTemetry Amazon SDK instrumentation by calling AddAWSInstrumentation() to add Amazon SDK client instrumentation to TracerProvider
-
Create a wrapper function with the same signature as the original Lambda function. Call AWSLambdaWrapper.Trace() API and pass TracerProvider, the original Lambda
function, and its inputs as parameters. Set the wrapper function as the Lambda handler input.
For the following code example, you will need the following dependencies:
dotnet add package OpenTelemetry.Instrumentation.AWSLambda
dotnet add package OpenTelemetry.Instrumentation.AWS
dotnet add package OpenTelemetry.Resources.AWS
dotnet add package AWS.Distro.OpenTelemetry.Exporter.Xray.Udp
The following code demonstrates the Lambda function after the required changes. You can create additional custom spans to complement the automatically provided spans.
using Amazon.Lambda.Core;
using Amazon.S3;
using Amazon.S3.Model;
using OpenTelemetry;
using OpenTelemetry.Instrumentation.AWSLambda;
using OpenTelemetry.Trace;
using AWS.Distro.OpenTelemetry.Exporter.Xray.Udp;
using OpenTelemetry.Resources;

// Assembly attribute to enable Lambda function logging
[assembly: LambdaSerializer(typeof(Amazon.Lambda.Serialization.SystemTextJson.DefaultLambdaJsonSerializer))]

namespace ExampleLambda;

public class ListBucketsHandler
{
    private static readonly AmazonS3Client s3Client = new();

    TracerProvider tracerProvider = Sdk.CreateTracerProviderBuilder()
        .AddAWSLambdaConfigurations()
        .AddProcessor(
            new SimpleActivityExportProcessor(
                // AWS_LAMBDA_FUNCTION_NAME Environment Variable will be defined in AWS Lambda Environment
                new XrayUdpExporter(ResourceBuilder.CreateDefault().AddService(Environment.GetEnvironmentVariable("AWS_LAMBDA_FUNCTION_NAME")).Build())
            )
        )
        .AddAWSInstrumentation()
        .SetSampler(new ParentBasedSampler(new AlwaysOnSampler()))
        .Build();

    // new Lambda function handler passed in
    public async Task<string> HandleRequest(object input, ILambdaContext context)
    => await AWSLambdaWrapper.Trace(tracerProvider, OriginalHandleRequest, input, context);

    public async Task<string> OriginalHandleRequest(object input, ILambdaContext context)
    {
        try
        {
            var DoListBucketsAsyncResponse = await DoListBucketsAsync();
            context.Logger.LogInformation($"Results: {DoListBucketsAsyncResponse.Buckets}");

            context.Logger.LogInformation($"Successfully called ListBucketsAsync");
            return "Success!";
        }
        catch (Exception ex)
        {
            context.Logger.LogError($"Failed to call ListBucketsAsync: {ex.Message}");
            throw;
        }
    }

    private async Task<ListBucketsResponse> DoListBucketsAsync()
    {
        try
        {
            var putRequest = new ListBucketsRequest
            {
            };

            var response = await s3Client.ListBucketsAsync(putRequest);
            return response;
        }
        catch (AmazonS3Exception ex)
        {
            throw new Exception($"Failed to call ListBucketsAsync: {ex.Message}", ex);
        }
    }
}
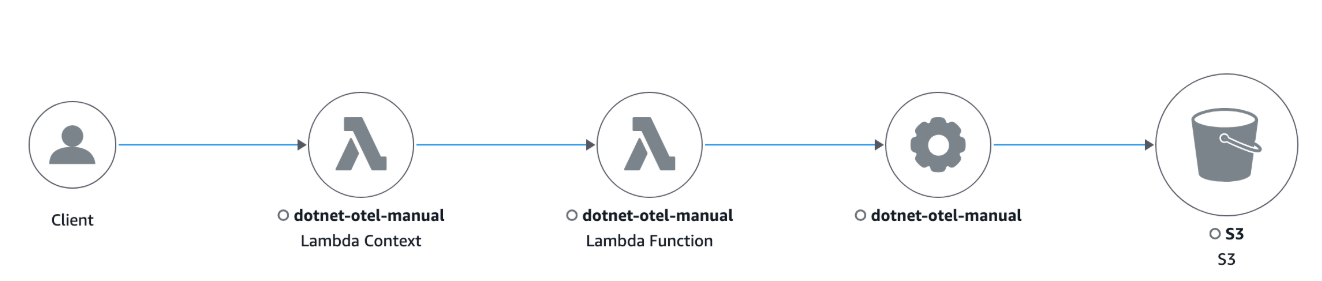
When invoking this Lambda, you will see the following trace in the Trace Map in the CloudWatch console: