What is Amazon X-Ray?
Amazon X-Ray is a service that collects data about requests that your application serves, and provides tools that you can use to view, filter, and gain insights into that data to identify issues and opportunities for optimization. For any traced request to your application, you can see detailed information not only about the request and response, but also about calls that your application makes to downstream Amazon resources, microservices, databases, and web APIs.

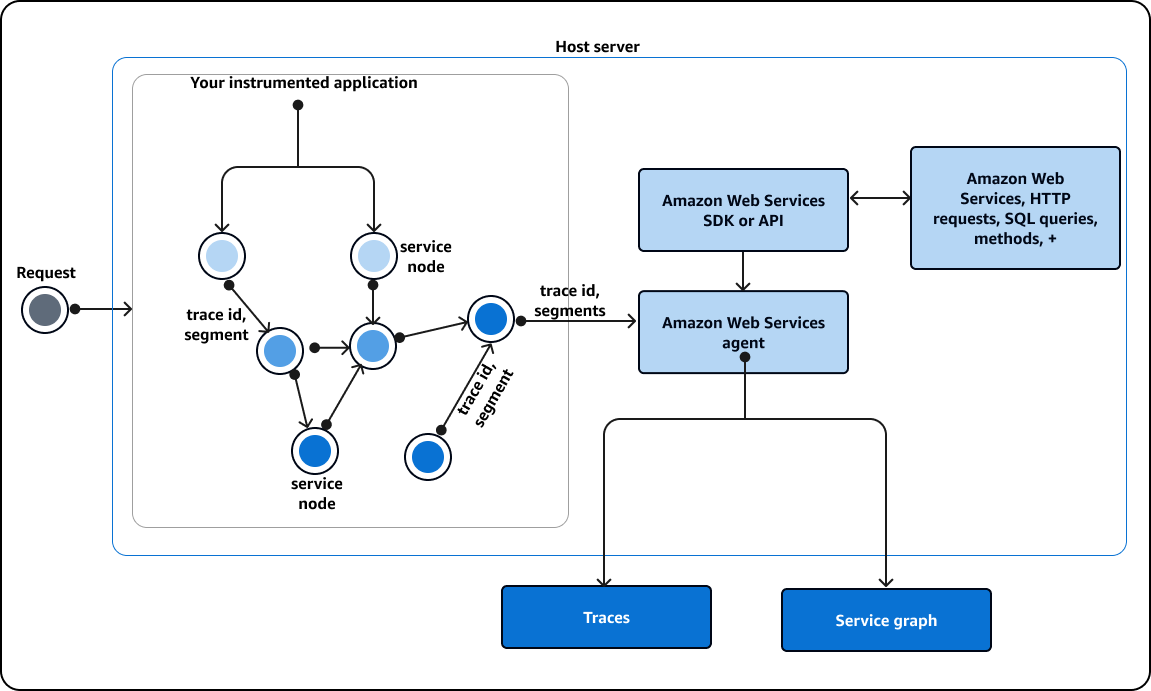
Amazon X-Ray receives traces from your application, in addition to Amazon Web Services services your application uses that are already integrated with X-Ray. Instrumenting your application involves sending trace data for incoming and outbound requests and other events within your application, along with metadata about each request. Many instrumentation scenarios require only configuration changes. For example, you can instrument all incoming HTTP requests and downstream calls to Amazon Web Services services that your Java application makes. There are several SDKs, agents, and tools that can be used to instrument your application for X-Ray tracing. See Instrumenting your application for more information.
Amazon Web Services services that are integrated with X-Ray can add tracing headers to incoming requests, send trace data to X-Ray, or run the X-Ray daemon. For example, Amazon Lambda can send trace data about requests to your Lambda functions, and run the X-Ray daemon on workers to make it simpler to use the X-Ray SDK.

Instead of sending trace data directly to X-Ray, each client SDK sends JSON segment documents to a daemon process listening for UDP traffic. The X-Ray daemon buffers segments in a queue and uploads them to X-Ray in batches. The daemon is available for Linux, Windows, and macOS, and is included on Amazon Elastic Beanstalk and Amazon Lambda platforms.
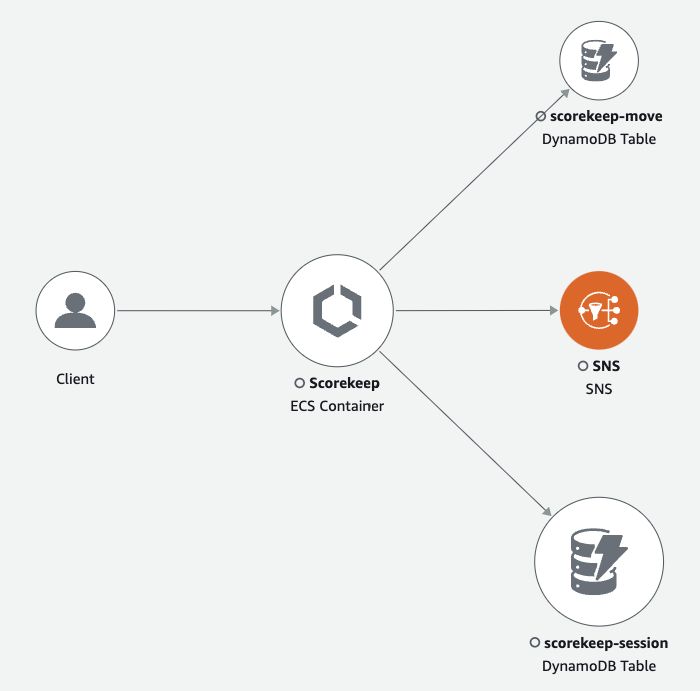
X-Ray uses trace data from the Amazon resources that power your cloud applications to generate a detailed trace map. The trace map shows the client, your front-end service, and backend services that your front-end service calls to process requests and persist data. Use the trace map to identify bottlenecks, latency spikes, and other issues to solve to improve the performance of your applications.
