Migrate to OpenTelemetry Ruby
To migrate your Ruby applications from X-Ray SDK to OpenTelemetry instrumentation, use the following code examples and guidance for manual instrumentation.
Sections
Manually instrument your solutions with the SDK
- Tracing setup with X-Ray SDK
-
X-Ray SDK for Ruby required you to configure your code with service plug-ins.
require 'aws-xray-sdk' XRay.recorder.configure(plugins: [:ec2, :elastic_beanstalk]) - Tracing setup with OpenTelemetry SDK
-
Note
X-Ray remote sampling is currently not available to be configured for OpenTelemetry Ruby.
For a Ruby on Rails application, place your configuration code in a Rails initializer. For more information, see Getting Started
. For all manually instrumented Ruby programs, you must use the OpenTelemetry::SDK.configuremethod to configure the OpenTelemetry Ruby SDK.First, install the following packages:
bundle add opentelemetry-sdk opentelemetry-exporter-otlp opentelemetry-propagator-xrayNext, configure the OpenTelemetry SDK through the configuration code that runs when your program initializes. It is recommend that you configure the following components:
-
OTLP Exporter– Required for exporting traces to the CloudWatch agent and OpenTelemetry collector -
An AmazonX-Ray Propagator– Required for propagating the trace context to Amazon services that are integrated with X-Ray
require 'opentelemetry-sdk'
require 'opentelemetry-exporter-otlp'

# Import the gem containing the AWS X-Ray for OTel Ruby ID Generator and propagator
require 'opentelemetry-propagator-xray'

OpenTelemetry::SDK.configure do |c|
  c.service_name = 'my-service-name'

  c.add_span_processor(
    # Use the BatchSpanProcessor to send traces in groups instead of one at a time
    OpenTelemetry::SDK::Trace::Export::BatchSpanProcessor.new(
      # Use the default OLTP Exporter to send traces to the ADOT Collector
      OpenTelemetry::Exporter::OTLP::Exporter.new(
        # The OpenTelemetry Collector is running as a sidecar and listening on port 4318
        endpoint:"http://127.0.0.1:4318/v1/traces"
      )
    )
  )

  # The X-Ray Propagator injects the X-Ray Tracing Header into downstream calls
  c.propagators = [OpenTelemetry::Propagator::XRay::TextMapPropagator.new]
end
OpenTelemetry SDKs also have the concept of library instrumentations. Enabling these will automatically create spans for libraries such as the Amazon SDK. OpenTelemetry provides the option to enable all library instrumentations or specify which library instrumentations to enable.
To enable all instrumentations, first install the
opentelemetry-instrumentation-allpackage:bundle add opentelemetry-instrumentation-allNext, update the configuration to enable all library instrumentations as shown below:
require 'opentelemetry/instrumentation/all'
...

OpenTelemetry::SDK.configure do |c|
   ...

  c.use_all() # Enable all instrumentations
end
OpenTelemetry SDKs also have the concept of library instrumentations. Enabling these will automatically create spans for libraries such as the Amazon SDK. OpenTelemetry provides the option to enable all library instrumentations or specify which library instrumentations to enable.
To enable all instrumentations, first install the
opentelemetry-instrumentation-allpackage:bundle add opentelemetry-instrumentation-allNext, update the configuration to enable all library instrumentations as shown below:
require 'opentelemetry/instrumentation/all' ... OpenTelemetry::SDK.configure do |c| ... c.use_all() # Enable all instrumentations end -
Tracing incoming requests (Rails instrumentation)
- With X-Ray SDK
-
With X-Ray SDK, X-Ray tracing is configured for the Rails framework upon initialization.
Example – config/initializers/aws_xray.rb
Rails.application.config.xray = { name: 'my app', patch: %I[net_http aws_sdk], active_record: true } - With OpenTelemetry SDK
First, install the following packages:
bundle add opentelemetry-instrumentation-rack opentelemetry-instrumentation-rails opentelemetry-instrumentation-action_pack opentelemetry-instrumentation-active_record opentelemetry-instrumentation-action_viewNext, update the configuration to enable instrumentation for your Rails application as shown below:
# During SDK configuration
OpenTelemetry::SDK.configure do |c|

  ...

  c.use 'OpenTelemetry::Instrumentation::Rails'
  c.use 'OpenTelemetry::Instrumentation::Rack'
  c.use 'OpenTelemetry::Instrumentation::ActionPack'
  c.use 'OpenTelemetry::Instrumentation::ActiveSupport'
  c.use 'OpenTelemetry::Instrumentation::ActionView'

  ...

end
Amazon SDK instrumentation
- With X-Ray SDK
-
To instrument outgoing Amazon requests from Amazon SDK, the Amazon SDK clients are patched with X-Ray like the following example:
require 'aws-xray-sdk' require 'aws-sdk-s3' # Patch Amazon SDK clients XRay.recorder.configure(plugins: [:aws_sdk]) # Use the instrumented client s3 = Aws::S3::Client.new s3.list_buckets - With OpenTelemetry SDK
Amazon SDK for Ruby V3 provides support for recording and emitting OpenTelemetry traces. For information on how to configure OpenTelemetry for a service client, see Configuring observability features in the Amazon SDK for Ruby .
Instrumenting outgoing HTTP calls
When making HTTP calls to external services, you might need to manually instrument the calls if automatic instrumentation isn’t available or doesn’t provide enough detail.
- With X-Ray SDK
-
To instrument downstream calls, the X-Ray SDK for Ruby was used to patch the
net/httplibrary that your application uses:require 'aws-xray-sdk' config = { name: 'my app', patch: %I[net_http] } XRay.recorder.configure(config) - With OpenTelemetry SDK
To enable the
net/httpinstrumentation using OpenTelemetry, first install theopentelemetry-instrumentation-net_httppackage:bundle add opentelemetry-instrumentation-net_httpNext, update the configuration to enable the
net/httpinstrumentation as shown below:OpenTelemetry::SDK.configure do |c| ... c.use 'OpenTelemetry::Instrumentation::Net::HTTP' ... end
Instrumentation support for other libraries
You can find the full list of supported Library instrumentations for OpenTelemetry Ruby under opentelemetry-ruby-contrib
Alternatively, you can search the OpenTelemetry Registry to find out if OpenTelemetry supports instrumentation. For more information, see Registry
Manually creating trace data
- With X-Ray SDK
-
Using X-Ray, the
aws-xray-sdkpackage required you to manually create segments and their child sub-segments to trace your application. You may have also added X-Ray annotations and metadata to your segments or sub-segments:require 'aws-xray-sdk' ... # Start a segment segment = XRay.recorder.begin_segment('my-service') # Add annotations (indexed key-value pairs) segment.annotations[:user_id] = 'user-123' segment.annotations[:payment_status] = 'completed' # Add metadata (non-indexed data) segment.metadata[:order] = { id: 'order-456', items: [ { product_id: 'prod-1', quantity: 2 }, { product_id: 'prod-2', quantity: 1 } ], total: 67.99 } # Add metadata to a specific namespace segment.metadata(namespace: 'payment') do |metadata| metadata[:transaction_id] = 'tx-789' metadata[:payment_method] = 'credit_card' end # Create a subsegment with annotations and metadata segment.subsegment('payment-processing') do |subsegment1| subsegment1.annotations[:payment_id] = 'pay-123' subsegment1.metadata[:details] = { amount: 67.99, currency: 'USD' } # Create a nested subsegment subsegment1.subsegment('operation-2') do |subsegment2| # Do more work... end end # Close the segment segment.close - With OpenTelemetry SDK
-
You can use custom spans to monitor the performance of internal activities that are not captured by instrumentation libraries. Note that only spans of kind server are converted into X-Ray segments, all other spans are converted into X-Ray sub-segments. By default, spans are
INTERNAL.First, create a Tracer in order to generate spans, which you can obtain through the
OpenTelemetry.tracer_provider.tracer('<YOUR_TRACER_NAME>')method. This will provide a Tracer instance that is registered globally in you application's OpenTelemetry configuration. It is common to have a single Tracer for an entire application. Create an OpenTelemetry tracer and use it to create spans:require 'opentelemetry-sdk' ... # Get a tracer tracer = OpenTelemetry.tracer_provider.tracer('my-application') # Create a server span (equivalent to X-Ray segment) tracer.in_span('my-application', kind: OpenTelemetry::Trace::SpanKind::SERVER) do |span| # Do work... # Create nested spans of default kind INTERNAL will become an X-Ray subsegment tracer.in_span('operation-1') do |child_span1| # Set attributes (equivalent to X-Ray annotations and metadata) child_span1.set_attribute('key', 'value') # Do more work... tracer.in_span('operation-2') do |child_span2| # Do more work... end end endAdding annotations and metadata to traces with OpenTelemetry SDK
Use the
set_attributemethod to add attributes to each span. Note that by default, all these span attributes will be converted into metadata in X-Ray raw data. To ensure that an attribute is converted into an annotation and not metadata, you can add that attributes key to the list ofaws.xray.annotationsattribute. For more information, see Enable The Customized X-Ray Annotations. # SERVER span will become an X-Ray segment tracer.in_span('my-server-operation', kind: OpenTelemetry::Trace::SpanKind::SERVER) do |span| # Your server logic here span.set_attribute('attribute.key', 'attribute.value') span.set_attribute("metadataKey", "metadataValue") span.set_attribute("annotationKey1", "annotationValue") # Create X-Ray annotations span.set_attribute("aws.xray.annotations", ["annotationKey1"]) end
Lambda manual instrumentation
- With X-Ray SDK
-
After Active Tracing was enabled on Lambda, there are no additional configurations required to use the X-Ray SDK. Lambda will create a segment representing the Lambda handler invocation, and you can create sub-segments or instrument libraries using the X-Ray SDK without any additional configuration.
- With OpenTelemetry SDK
Consider the following sample Lambda function code (without instrumentation):
require 'json'
def lambda_handler(event:, context:)
    # TODO implement
    { statusCode: 200, body: JSON.generate('Hello from Lambda!') }
end
To manually instrument your Lambda, you will need to:
Add the following gems for your Lambda
gem 'opentelemetry-sdk'
gem 'opentelemetry-exporter-otlp'
gem 'opentelemetry-propagator-xray'
gem 'aws-distro-opentelemetry-exporter-xray-udp'
gem 'opentelemetry-instrumentation-aws_lambda'
gem 'opentelemetry-propagator-xray', '~> 0.24.0' # Requires version v0.24.0 or higher
Initialize OpenTelemetry SDK outside your Lambda Handler. The OpenTelemetry SDK is recommended to be configured with:
-
A simple span processor with an X-Ray UDP span exporter to send Traces to Lambda's UDP X-Ray endpoint
-
An X-Ray Lambda propagator
-
service_nameconfiguration to be set to the Lambda function name
-
In your Lambda handler class, add the following lines to instrument your Lambda Handler:
  class Handler
        extend OpenTelemetry::Instrumentation::AwsLambda::Wrap
        ...

        instrument_handler :process
    end
The following code demonstrates the Lambda function after the required changes. You can create additional custom spans to complement the automatically provided spans.
require 'json'
require 'opentelemetry-sdk'
require 'aws/distro/opentelemetry/exporter/xray/udp'
require 'opentelemetry/propagator/xray'
require 'opentelemetry/instrumentation/aws_lambda'

# Initialize OpenTelemetry SDK outside handler
OpenTelemetry::SDK.configure do |c|
  # Configure the AWS Distro for OpenTelemetry X-Ray Lambda exporter
  c.add_span_processor(
    OpenTelemetry::SDK::Trace::Export::SimpleSpanProcessor.new(
      AWS::Distro::OpenTelemetry::Exporter::XRay::UDP::AWSXRayUDPSpanExporter.new
    )
  )

  # Configure X-Ray Lambda propagator
  c.propagators = [OpenTelemetry::Propagator::XRay.lambda_text_map_propagator]

  # Set minimal resource information
  c.resource = OpenTelemetry::SDK::Resources::Resource.create({
    OpenTelemetry::SemanticConventions::Resource::SERVICE_NAME => ENV['AWS_LAMBDA_FUNCTION_NAME']
  })
  c.use 'OpenTelemetry::Instrumentation::AwsLambda'
end

module LambdaFunctions
  class Handler
    extend OpenTelemetry::Instrumentation::AwsLambda::Wrap
    def self.process(event:, context:)
      "Hello!"
    end
    instrument_handler :process
  end
end
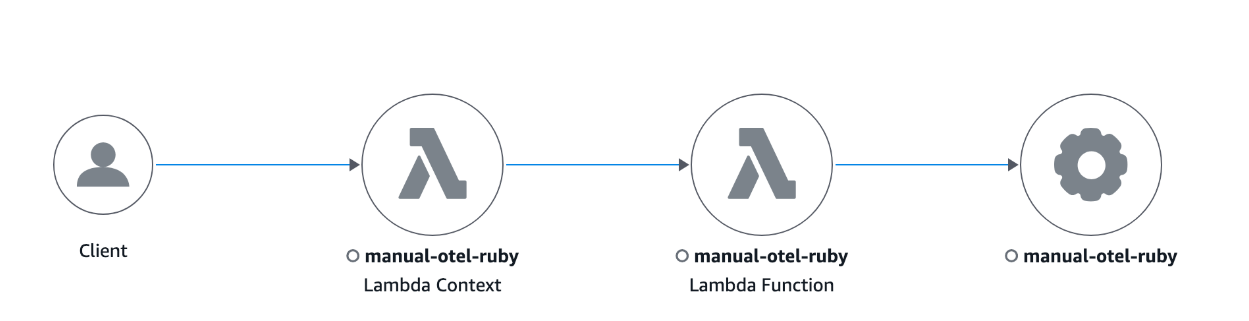
The following is an example trace map of an instrumented Lambda function written in Ruby.
You can also use Lambda layers to configure OpenTelemetry for your Lambda. For more information, see OpenTelemetry AWS-Lambda Instrumentation