本文属于机器翻译版本。若本译文内容与英语原文存在差异,则一律以英文原文为准。
发现痕迹
Discover Traces 页面提供了一个专门的界面,用于浏览 OpenSearch 服务可观测性工作空间中的分布式追踪数据。您可以查看服务的 RED 指标(比率、错误率、持续时间),使用分面筛选浏览跟踪跨度,并深入研究单个跨度和跟踪以诊断性能问题。该页面还支持将跟踪与相关日志数据关联起来。
访问 “跟踪” 页面
在您的可观测性工作区中,展开左侧导航栏中的 “发现”,然后选择 Traces 。
配置追踪数据集
在浏览追踪数据之前,必须先配置追踪数据集。您可以自动或手动创建数据集。
自动创建数据集
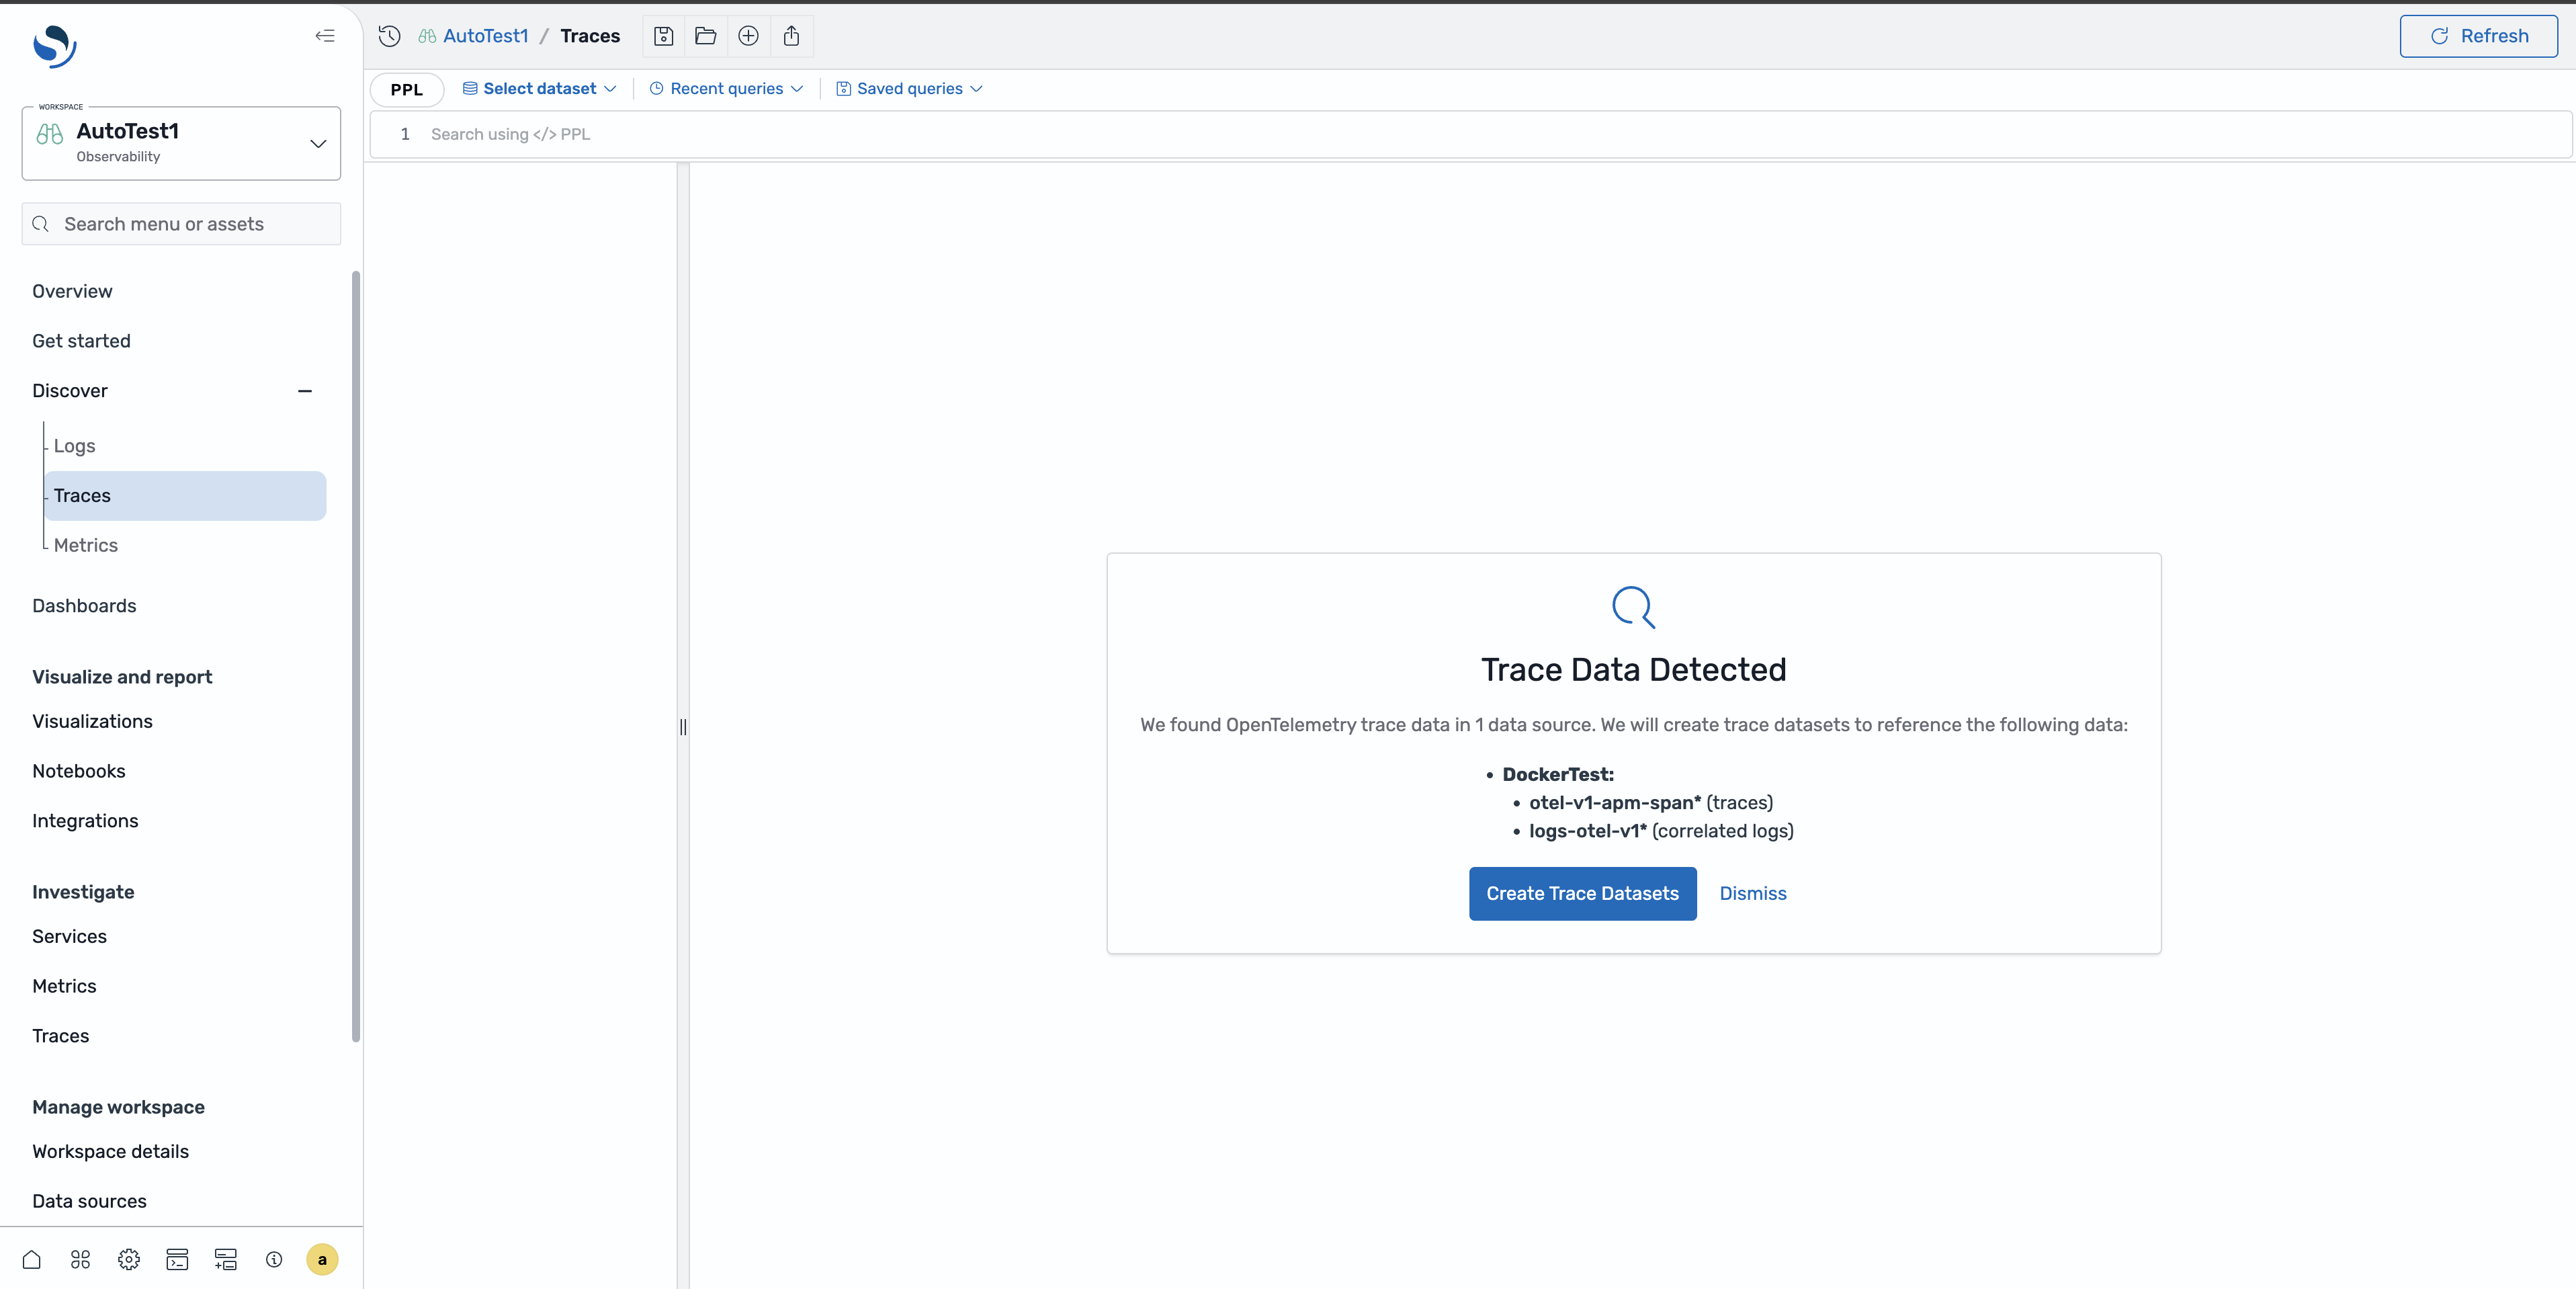
当您首次导航到 Discover Traces 页面并且您的域中存在追踪数据时,该页面会自动提示您创建数据集。选择创建数据集以接受默认配置。
手动创建数据集
要手动创建追踪数据集,请按照中的步骤操作创建追踪数据集。通过手动创建,您可以控制索引模式、时间戳字段和数据集名称。
探索跟踪数据
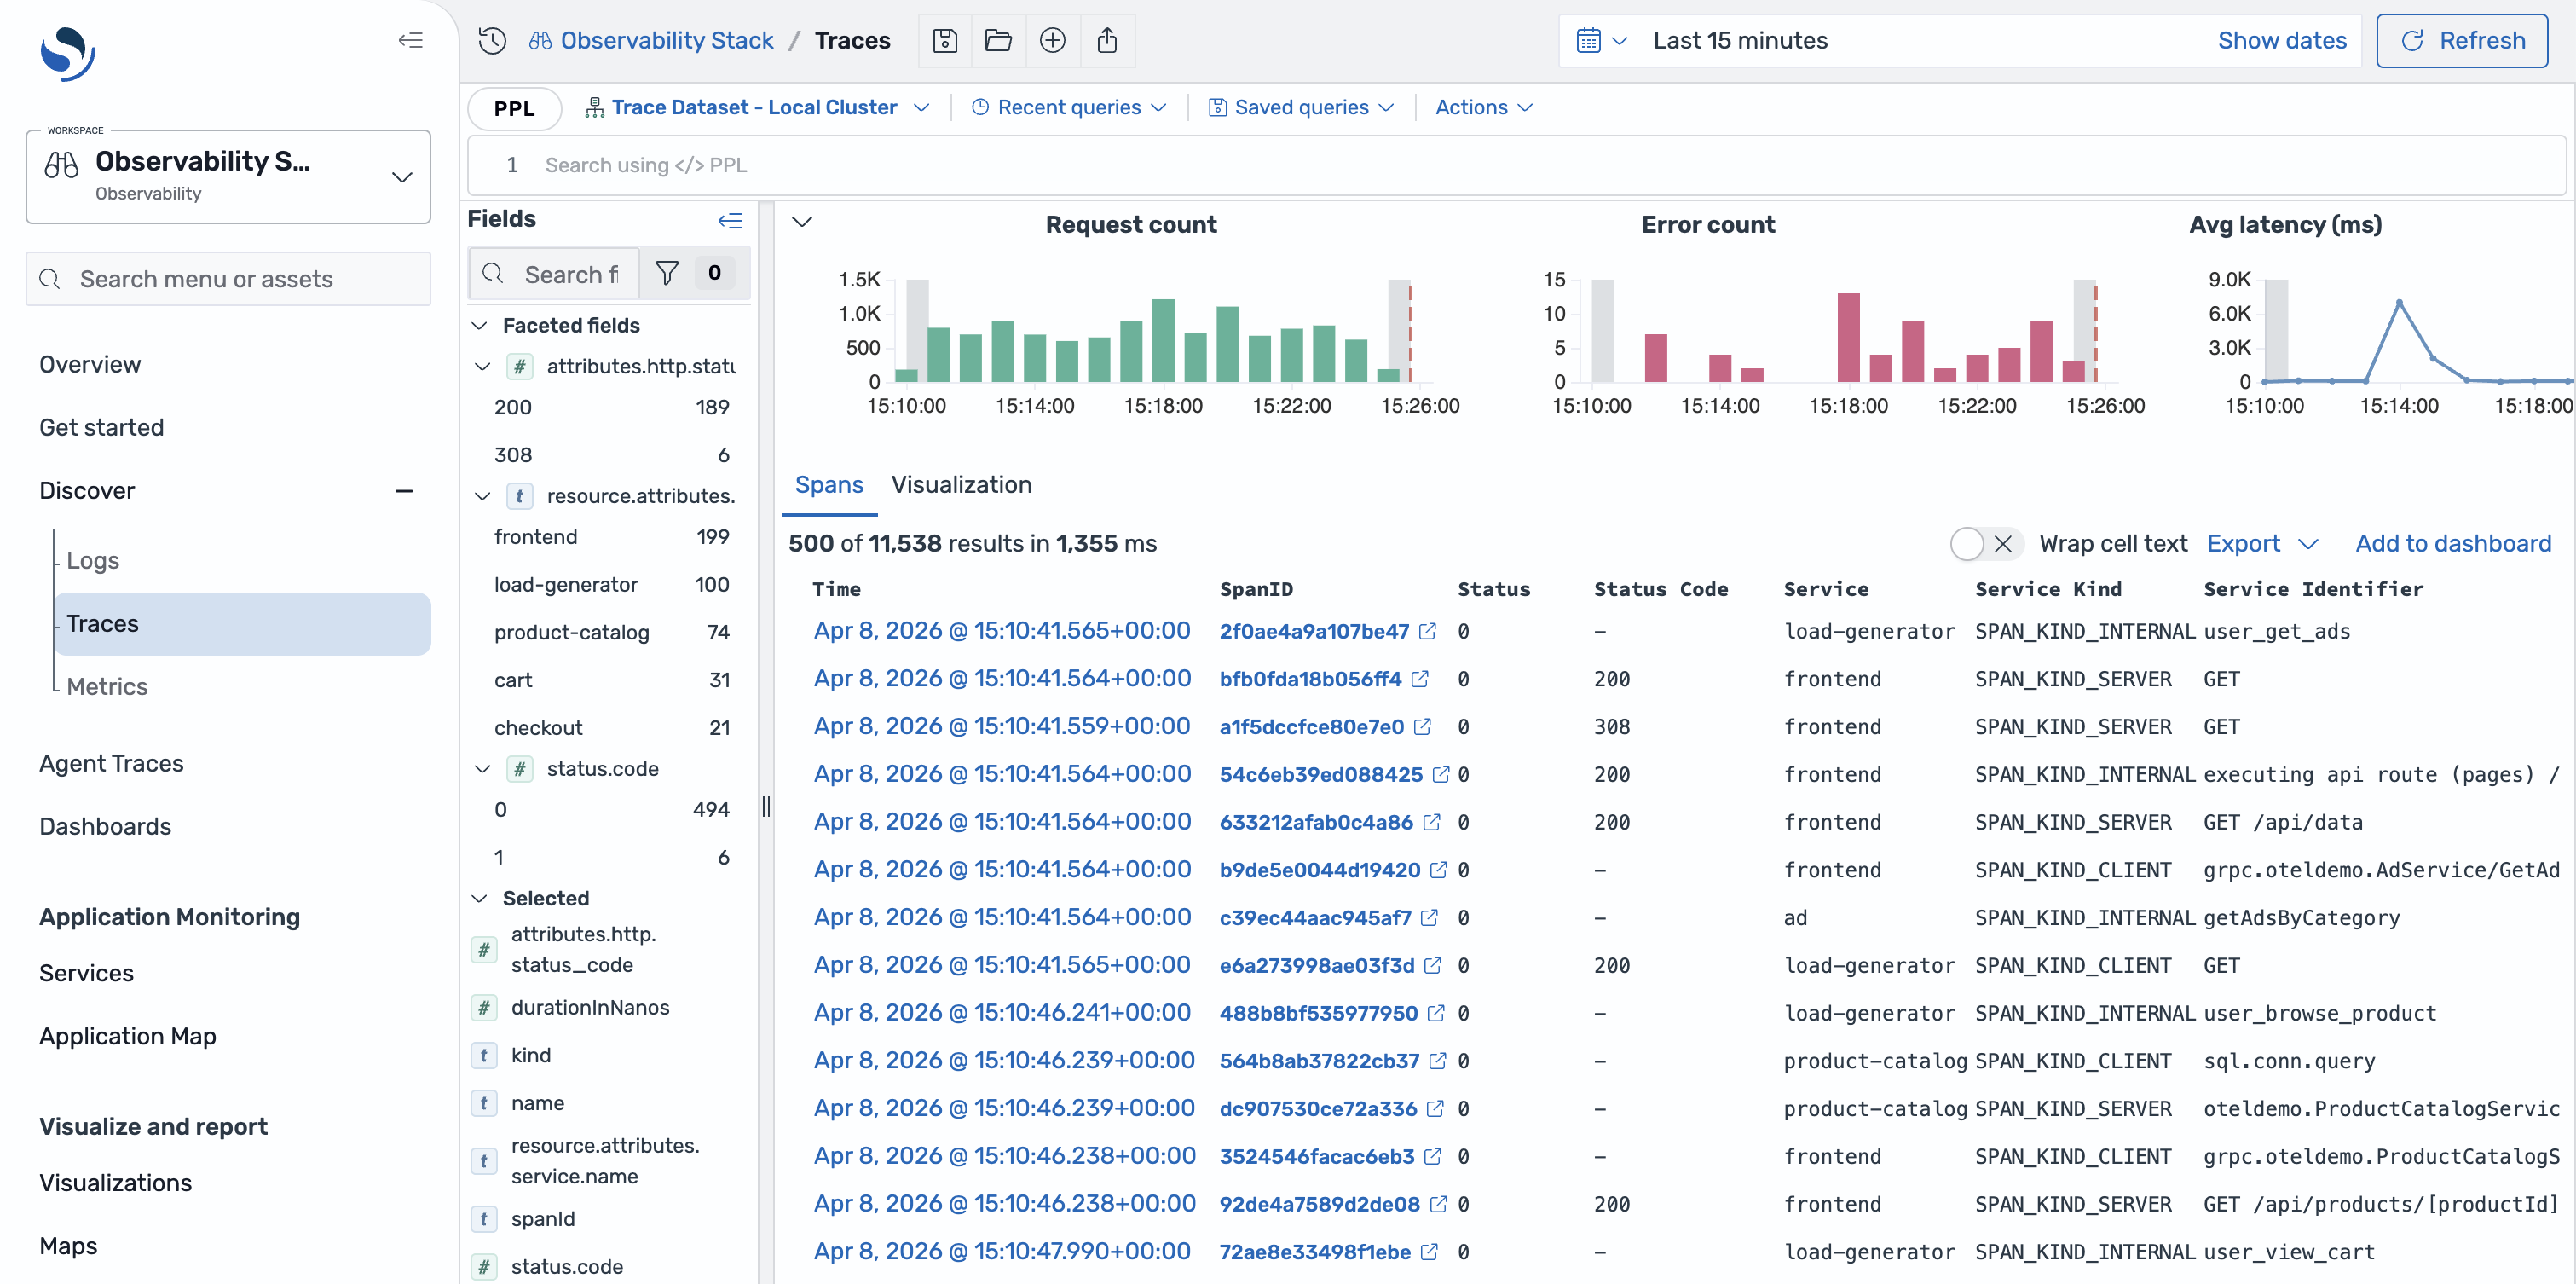
Discover Traces 页面提供了以下用于浏览跟踪数据的组件。
-
RED 指标-查看所选数据集的速率(每秒请求数)、错误率(失败请求的百分比)和持续时间(延迟百分比)。这些指标会根据您的时间过滤器进行更新。
-
分面字段-按服务名称、操作、状态代码和其他跨度属性筛选跟踪跨度。在分面字段面板中选择值以缩小结果范围。
-
跨度表-浏览各个跨度,其中包含跟踪 ID、跨度 ID、服务名称、操作、持续时间和状态列。您可以按任意列进行排序并展开行以查看跨度详细信息。
查看特定跨度
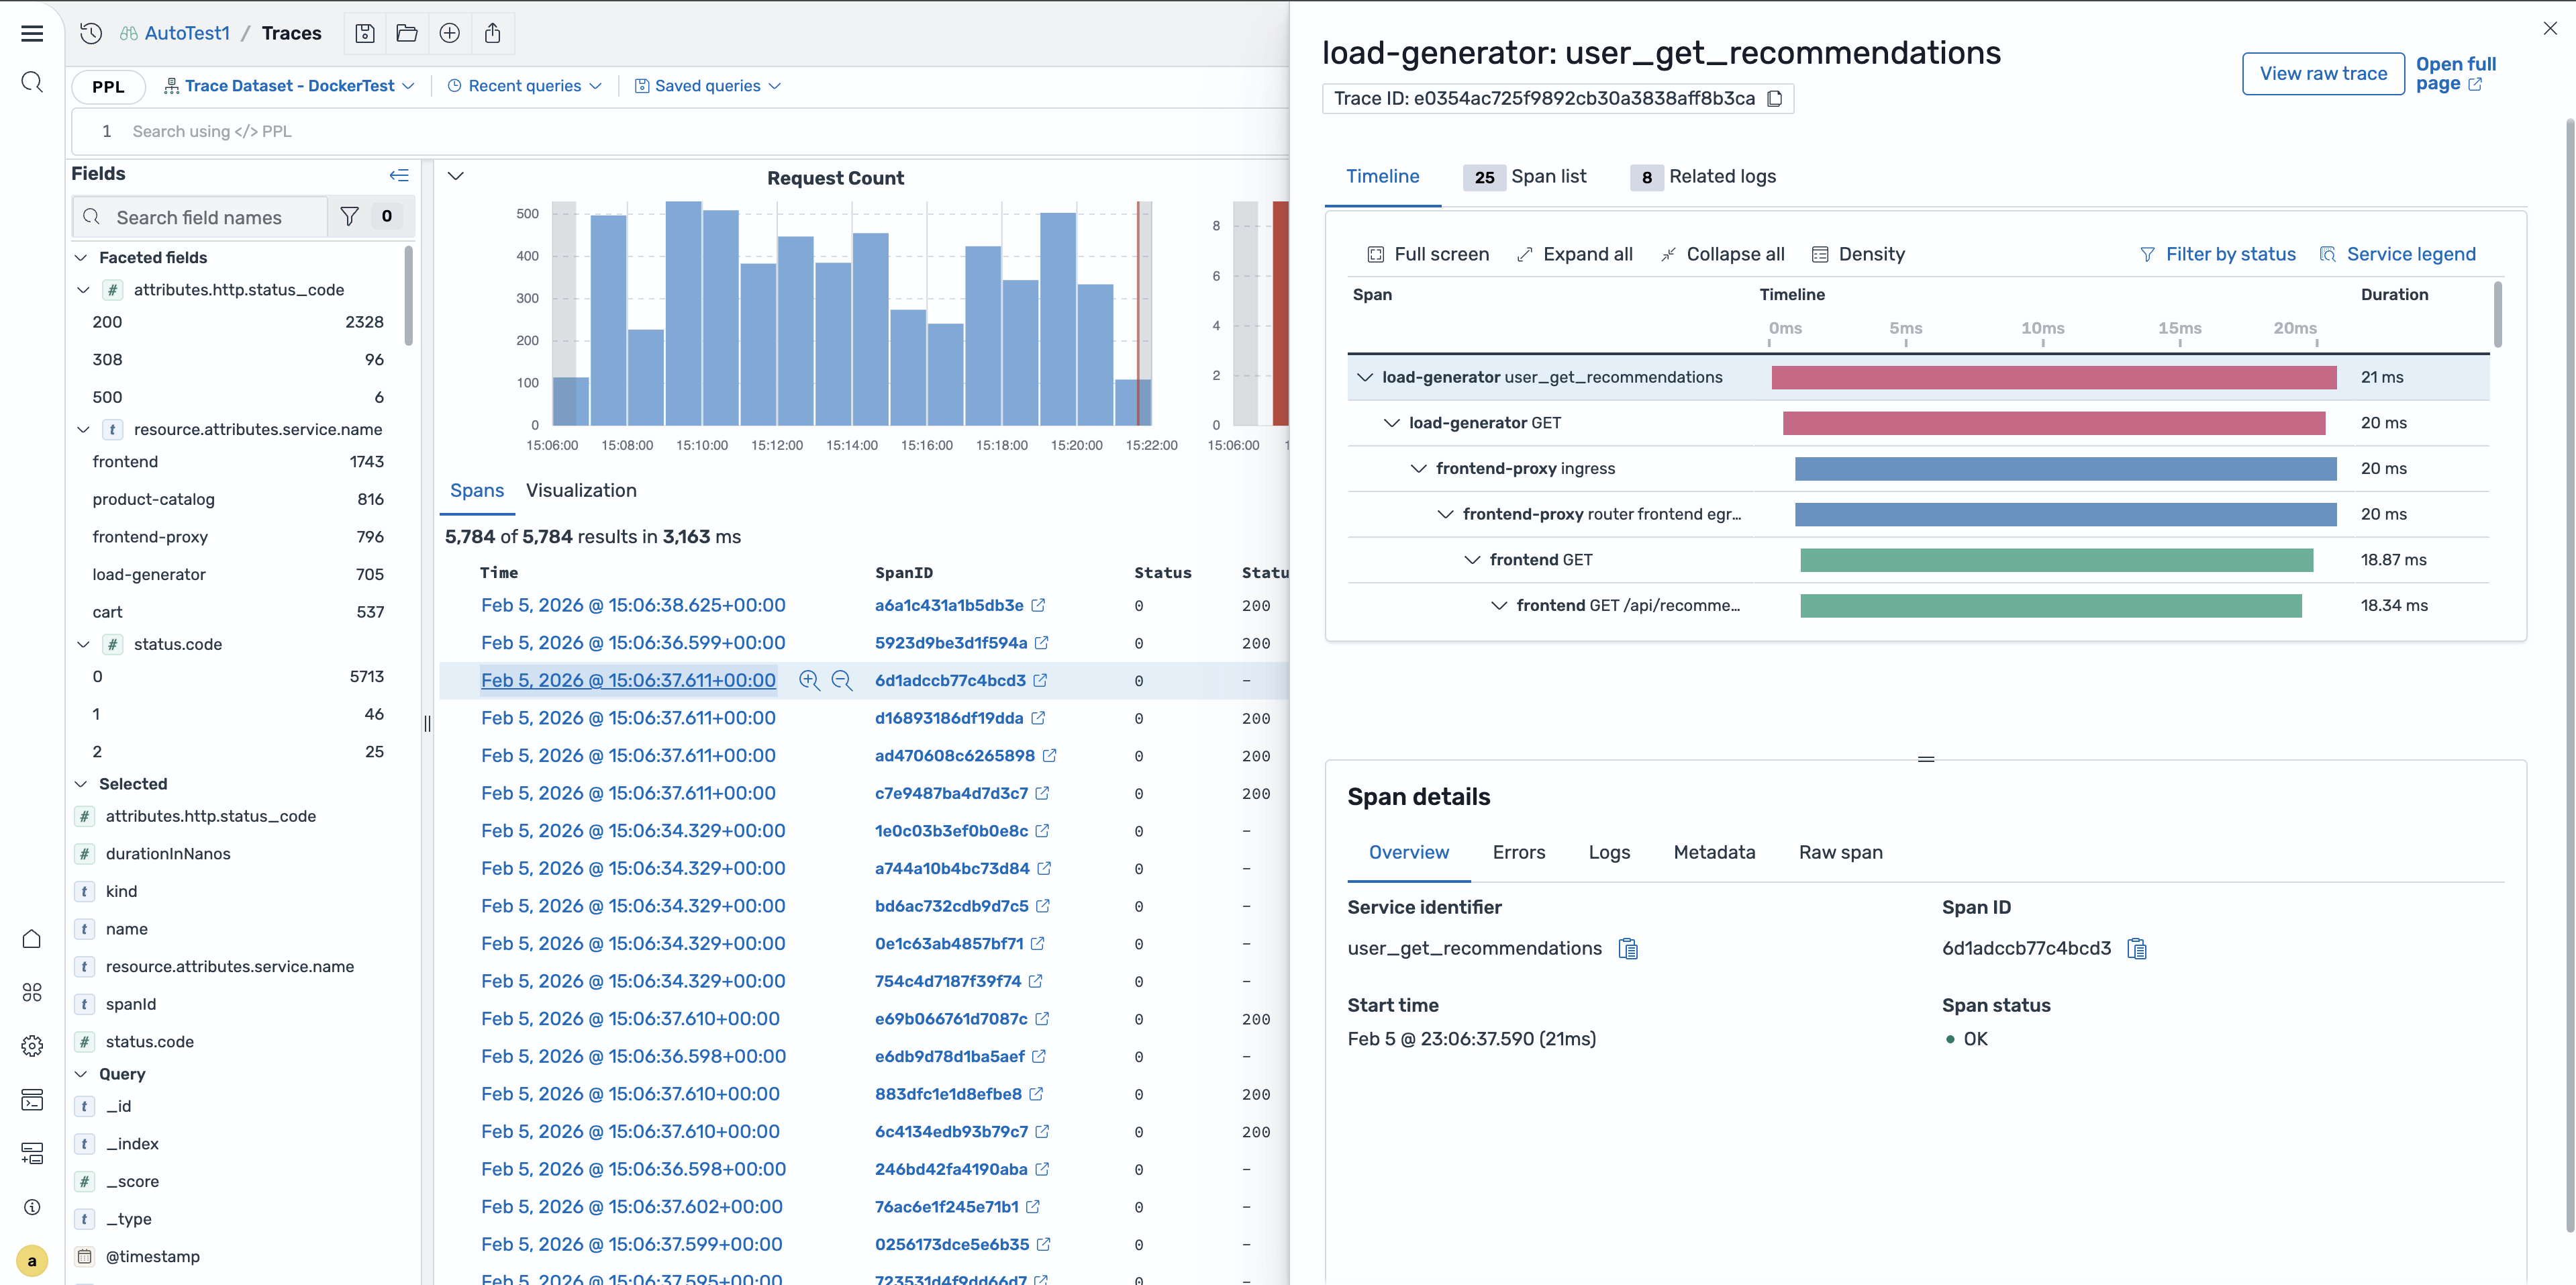
要查看特定跨度的详细信息,请在跨度表中选择该跨度行。将打开一个弹出式面板,其中包含跨度属性、资源属性和事件信息。
追踪详情页面
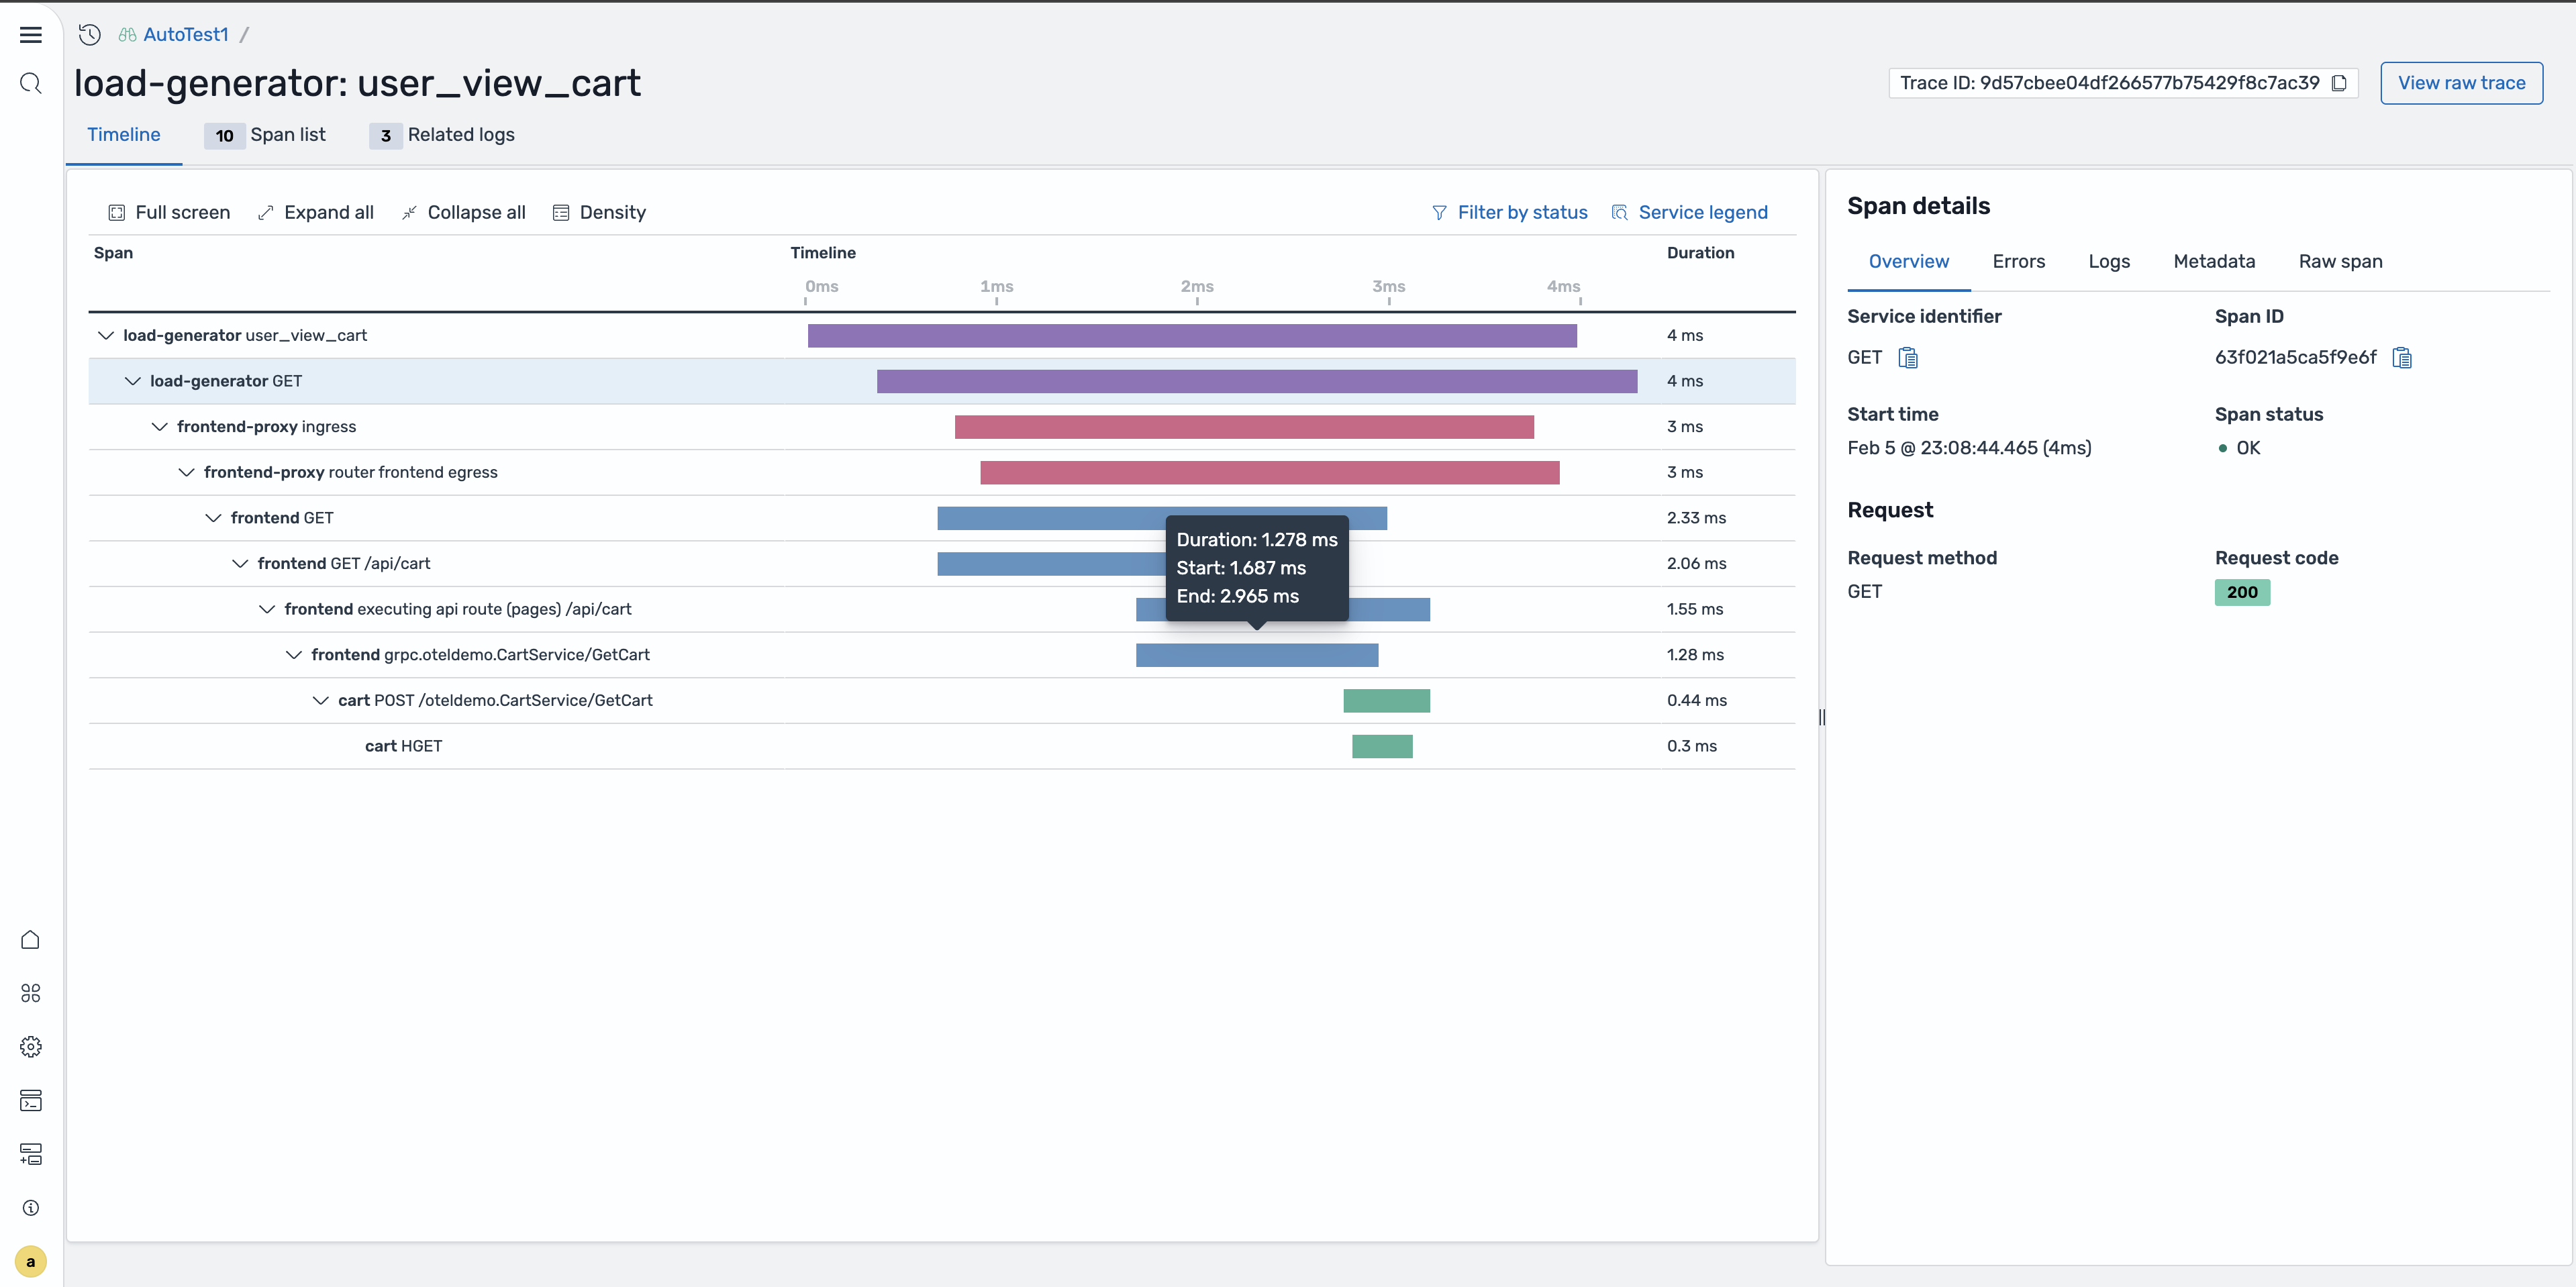
要查看完整的轨迹,请在跨度表或弹出式面板中选择跟踪 ID 链接。跟踪详细信息页面显示瀑布图,其中显示了追踪中的所有跨度、它们的时间关系以及总体跟踪持续时间。您可以扩展单个跨度以查看其属性并识别瓶颈。
将跟踪与日志相关联
在轨迹数据集和日志数据集之间配置关联时,可以直接从 Discover Traces 页面查看相关的日志条目。有关创建关联的信息,请参见关联。
查看相关日志
在跨度详细信息弹出窗口或跟踪详细信息页面中,选择相关日志选项卡,查看与跨度的跟踪 ID、服务名称和时间范围相匹配的日志条目。这种关联可以帮助您了解在 span 执行期间应用程序中发生了什么。
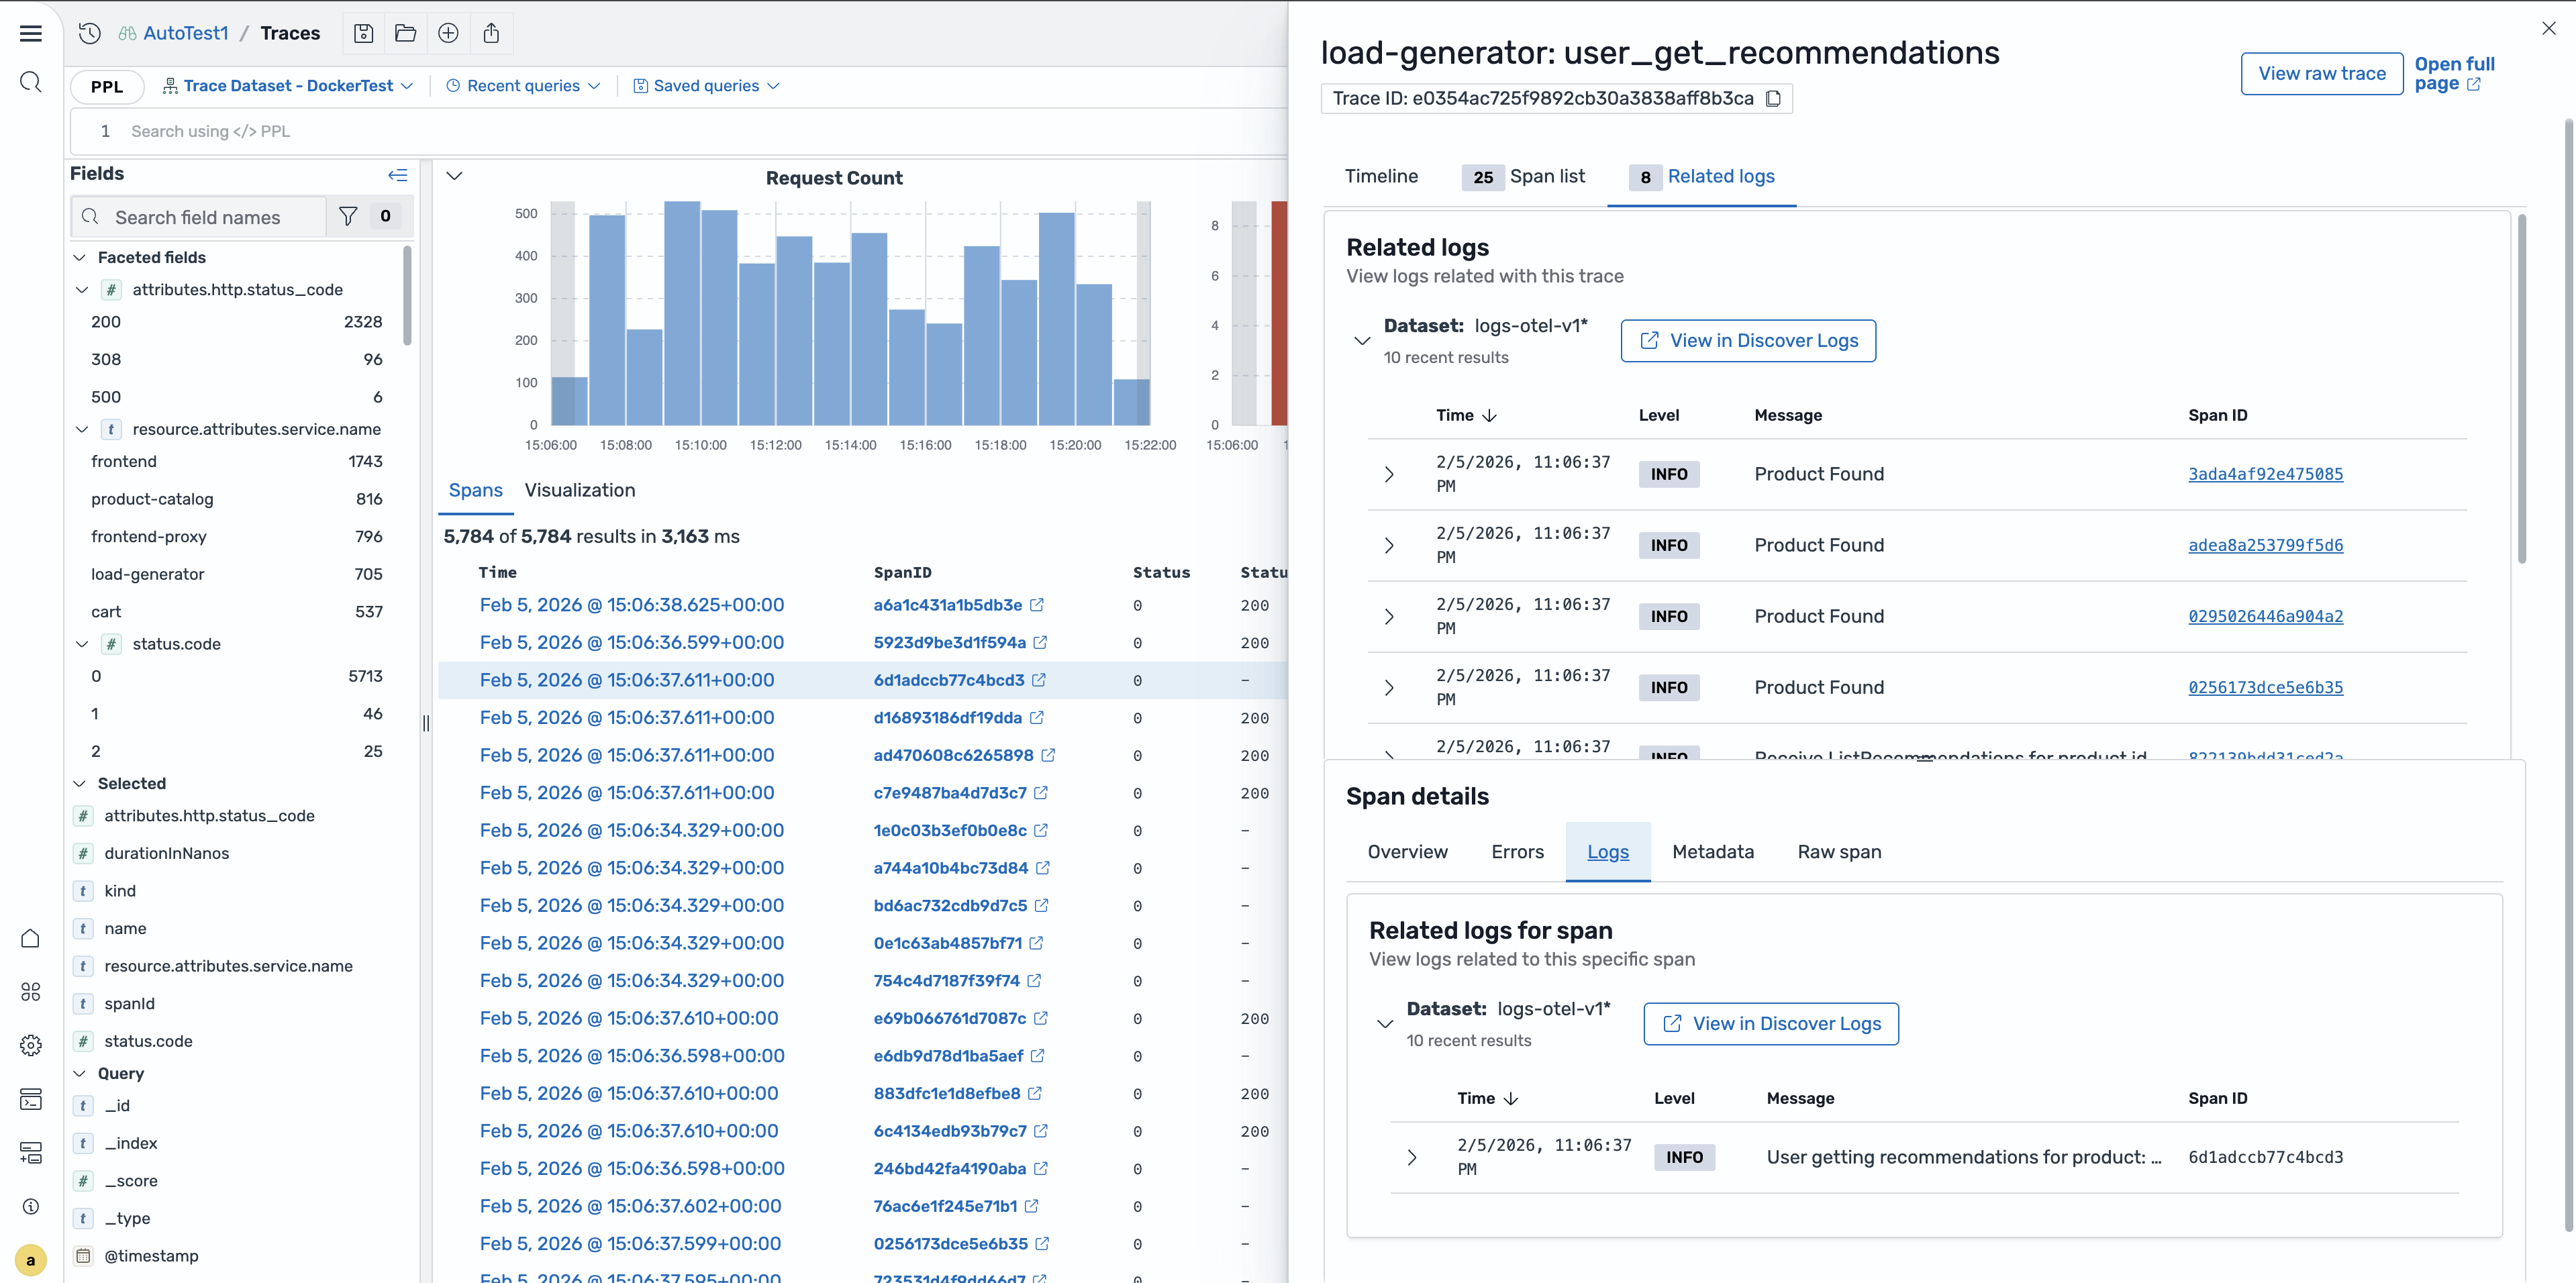
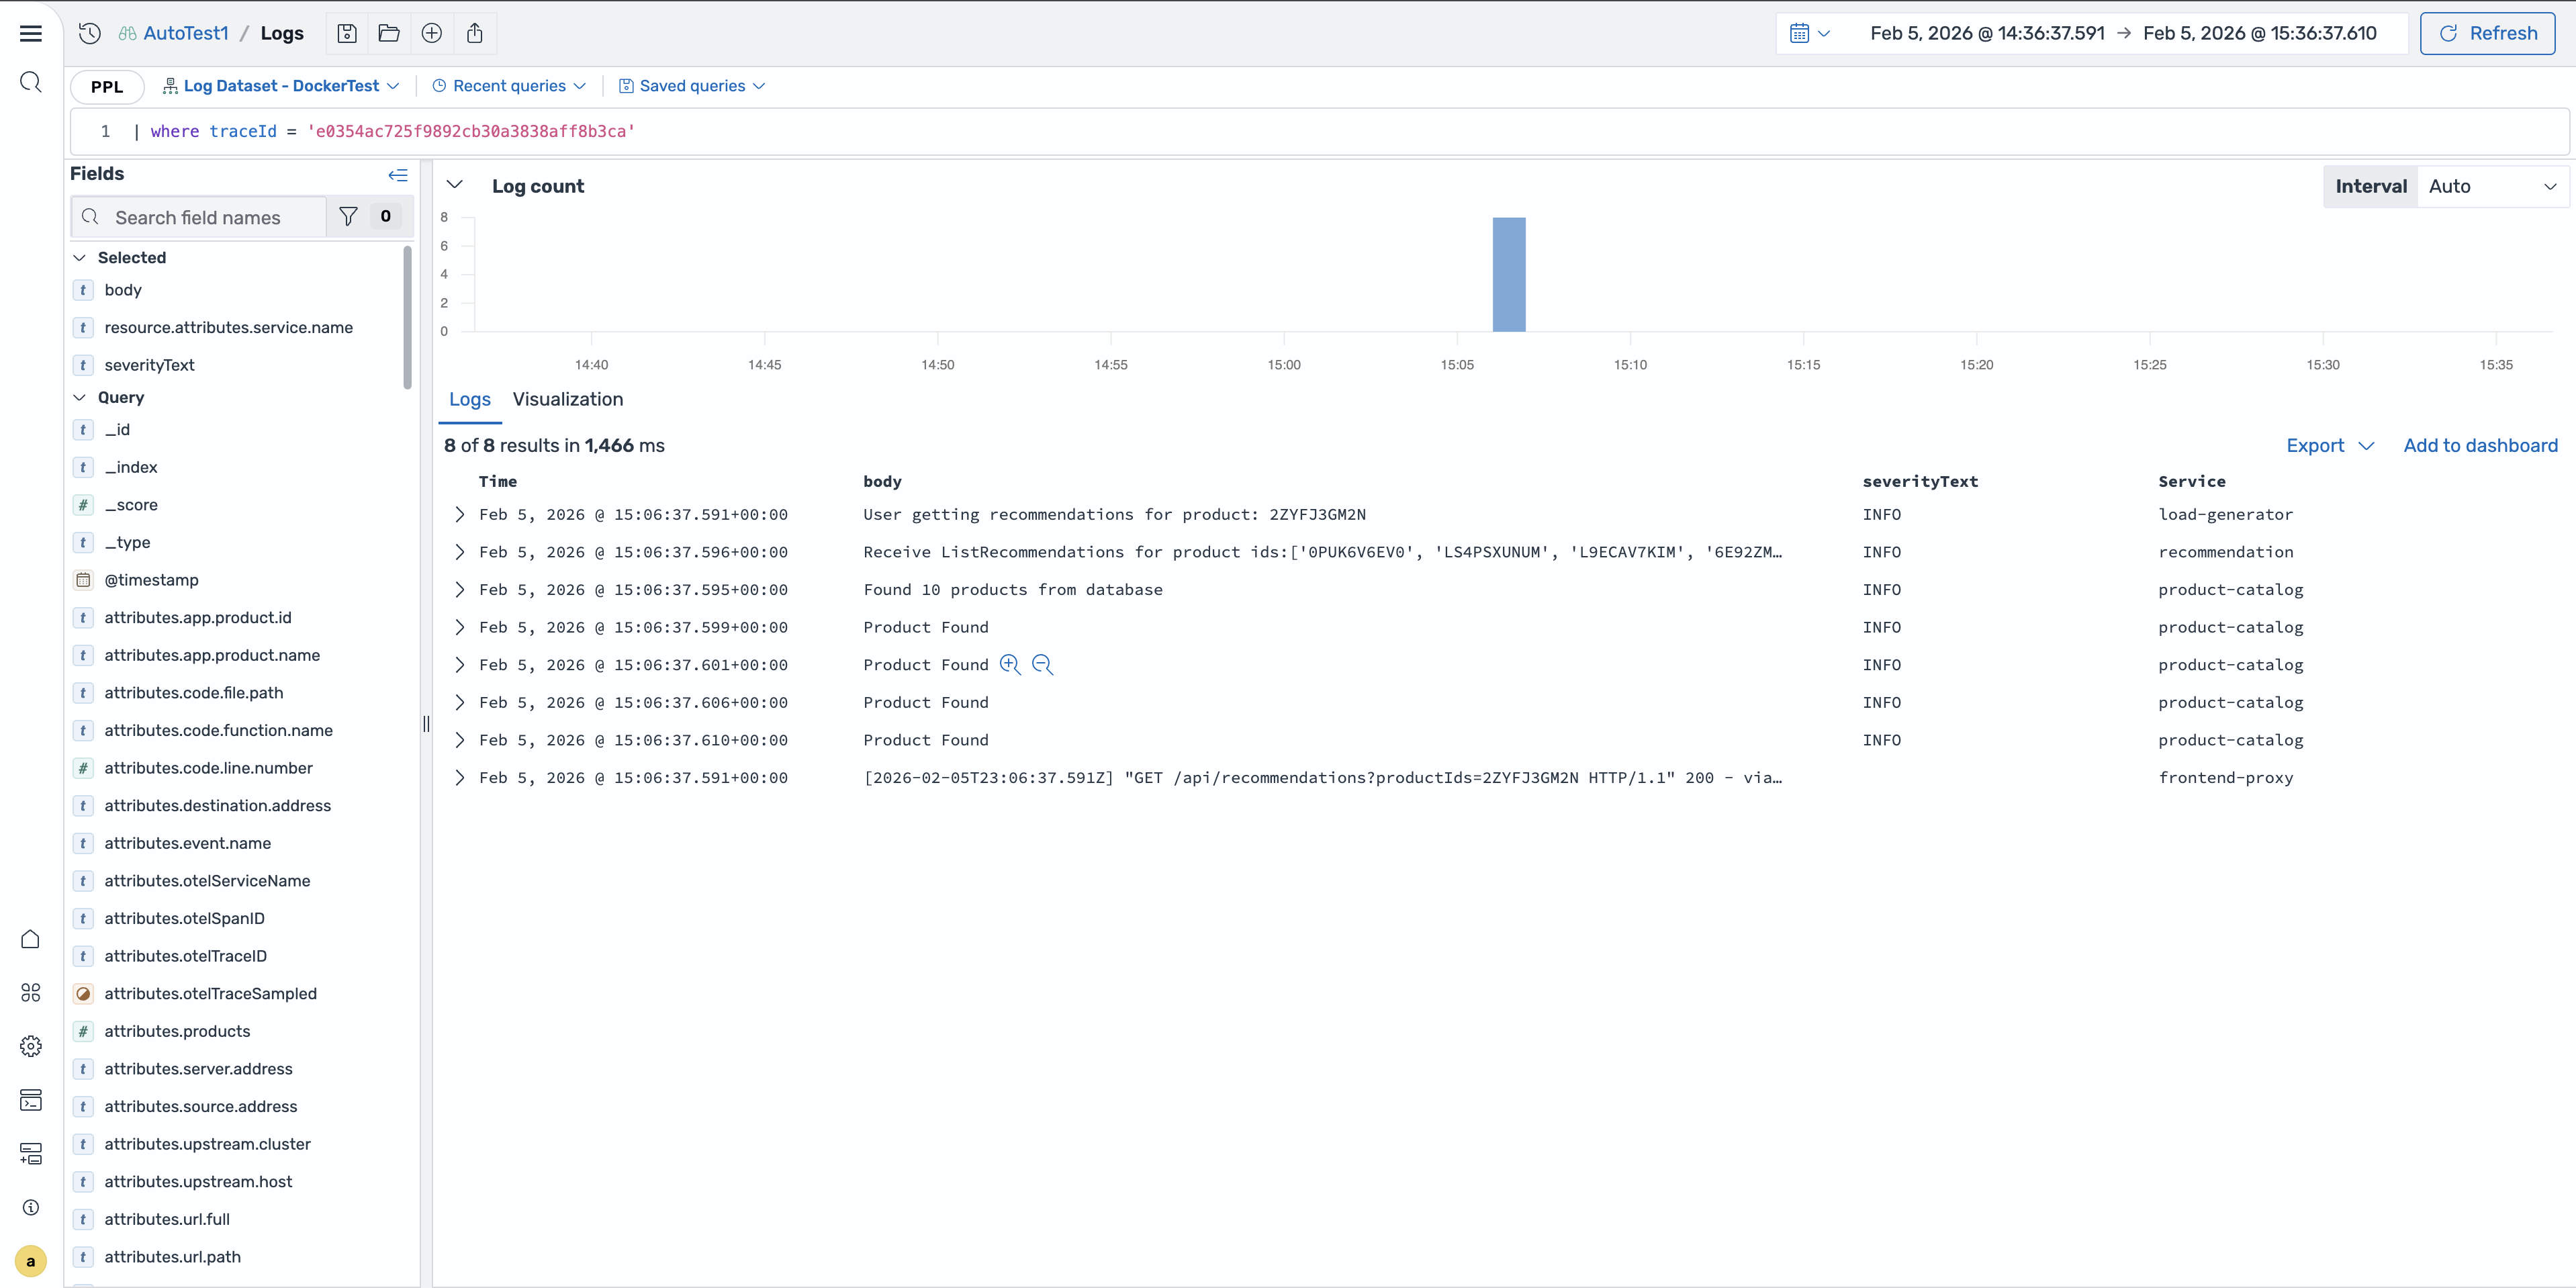
使用上下文记录重定向
在保留相关上下文的情况下,您可以直接从跟踪跨度导航到 “发现日志” 页面。从相关日志面板中选择 “在日志中查看”,打开 “发现日志” 页面,其中预先填充了查询,可按跨度的跟踪 ID 和时间范围进行筛选。
使用 PPL 查询轨迹
您可以使用 PPL 直接查询跟踪数据。PPL 使用管道字符串联命令来筛选、转换和聚合跨度数据。
以下示例查找最慢的 10 条轨迹:
source = otel-v1-apm-span-*
| where durationInNanos > 5000000000
| fields traceId, serviceName, name, durationInNanos
| sort - durationInNanos
| head 10
以下示例按服务对错误进行计数:
source = otel-v1-apm-span-*
| where status.code = 2
| stats count() as errorCount by serviceName
| sort - errorCount
以下示例查找特定服务的跟踪:
source = otel-v1-apm-span-*
| where serviceName = 'checkout-service'
| where parentSpanId = ''
| sort - startTime
| head 20