本文属于机器翻译版本。若本译文内容与英语原文存在差异,则一律以英文原文为准。
教程:在 Can SageMaker vas 中构建端到端的机器学习工作流程
本教程将指导您使用 Amazon C SageMaker anvas 完成端到端机器学习 (ML) 工作流程。 SageMaker Canvas 是一个可视化的无代码界面,可用于准备数据以及训练和部署机器学习模型。在本教程中,您将使用纽约市出租车数据集来训练一个模型来预测给定行程的车费金额。您可以亲身体验关键的机器学习任务,例如评估数据质量和解决数据问题、将数据拆分为训练和测试集、模型训练和评估、进行预测以及部署训练过的模型,所有这些都在 SageMaker Canvas 应用程序中完成。
重要
本教程假设您或您的管理员已经创建了一个 Amazon 帐户。有关创建 Amazon 账户的信息,请参阅入门:你是第一次 Amazon 使用吗?
设置
Amazon SageMaker AI 域是管理所有亚马逊 A SageMaker I 环境和资源的集中场所。域充当你在 SageMaker AI 中工作的虚拟边界,为你的机器学习 (ML) 资源提供隔离和访问控制。
要开始使用 Amazon SageMaker Canvas,您或您的管理员必须导航到 SageMaker AI 控制台并创建亚马逊 SageMaker AI 域。域拥有运行 C SageMaker anvas 所需的存储和计算资源。在该域中,您可以将 SageMaker Canvas 配置为访问您的 Amazon S3 存储桶并部署模型。使用以下步骤设置快速域并创建 SageMaker Canvas 应用程序。
设置 SageMaker 画布
-
导航到 A SageMaker I 控制台
。 -
在左侧导航栏中,选择 “ SageMaker 画布”。
-
选择创建 A SageMaker I 域。
-
选择设置。域设置需要几分钟时间。
前面的步骤使用的是快速域设置。您可以执行高级设置,控制账户配置的各个方面,包括权限、集成和加密。有关自定义设置的更多信息,请参阅 使用 Amazon A SageMaker I 的自定义设置。
默认情况下,进行快速域设置后,您就拥有了部署模型的权限。如果您通过标准域设置了自定义权限,并且需要手动授予模型部署权限,请参阅 权限管理。
流创建
Amazon SageMaker Canvas 是一个机器学习平台,使用户无需大量的编码或机器学习专业知识即可构建、训练和部署机器学习模型。Amazon SageMaker Canvas 的强大功能之一是能够导入和处理来自各种来源(例如 Amazon S3)的大型数据集。
在本教程中,我们将使用纽约出租车数据集,使用 Amazon Canvas Data Wrangler 数据 SageMaker 流预测每次行程的票价。以下过程概述了将修改后的纽约市出租车数据集导入数据流的步骤。
注意
为了改进处理能力, SageMaker Canvas 会导入您的数据样本。默认情况下,它会随机采样 50000 行。
要导入纽约市出租车数据集
-
在 SageMaker Canvas 主页上,选择 Data Wrangler。
-
选择导入数据。
-
选择表格。
-
选择数据来源旁边的工具箱。
-
从下拉列表中选择 Amazon S3。
-
对于输入 S3 端点,请指定
s3://amazon-sagemaker-data-wrangler-documentation-artifacts/canvas-single-file-nyc-taxi-dataset.csv -
选择开始。
-
选中数据集旁边的复选框。
-
选择预览数据。
-
选择保存。
数据质量和见解报告 1(样本)
将数据集导入 Amazon SageMaker Canvas 后,您可以根据数据样本生成数据质量和见解报告。利用它为数据集提供有用的见解。此报告的作用如下:
-
评测数据集的完整性
-
识别缺失值和异常值
它可以找出可能影响模型性能的其他潜在问题。它还能评估每个功能对目标变量的预测能力,从而使您能够确定与要解决的问题最相关的功能。
我们可以利用报告中的见解来预测票价金额。通过指定票价金额列为目标变量并选择回归作为问题类型,报告将分析数据集是否适合预测票价等连续值。此报告应显示 year 和 hour_of_day 等功能对所选目标变量的预测能力较低,从而为您提供有用的见解。
按照以下步骤从数据集中获取 50000 行样本的数据质量和见解报告。
要获取样本报告
-
从数据类型节点旁边的弹出窗口中选择获取数据见解。
-
在分析名称中,为报告指定名称。
-
在问题类型中,选择回归。
-
在目标列中,选择票价金额。
-
选择创建。
您可以查看有关数据样本的“数据质量和见解”报告。此报告显示,year 和 hour_of_day 功能无法预测目标变量票价金额。
在导航的顶部,选择数据流的名称以返回到次数据流。
删除“year”和“hour of day”
我们正在使用报告中的见解来删除 year 和 hour_of_day 列,以简化功能空间,并有可能提高模型性能。
Amazon SageMaker Canvas 提供了用户友好的界面和工具来执行此类数据转换。
使用 Amazon Canvas 中的 Data Wrangler 工具,使用以下步骤从纽约出租车数据集中删除年份和 hour_of_day 列。 SageMaker
-
选择数据类型旁边的图标。
-
选择添加步骤。
-
在搜索栏中输入删除列。
-
选择管理列。
-
选择删除列。
-
在要删除的列中,请选择 year 和 hour_of_day。
-
选择预览,查看转换如何更改数据。
-
选择添加。
您可以使用上述过程作为基础,在 Can SageMaker vas 中添加所有其他变换。
数据质量和见解报告 2(完整数据集)
在之前的见解报告中,我们使用了纽约市出租车数据集的样本。在第二份报告中,我们将对整个数据集进行全面分析,以确定影响模型性能的潜在问题。
按照以下步骤为整个数据集创建数据质量和见解报告。
获取有关整个数据集的报告
-
选择删除列节点旁边的图标。
-
选择获取数据见解。
-
在分析名称中,为报告指定名称。
-
在问题类型中,选择回归。
-
在目标列中,选择票价金额。
-
在数据大小中,选择完整数据集。
-
选择创建。
以下是见解报告中的图片:
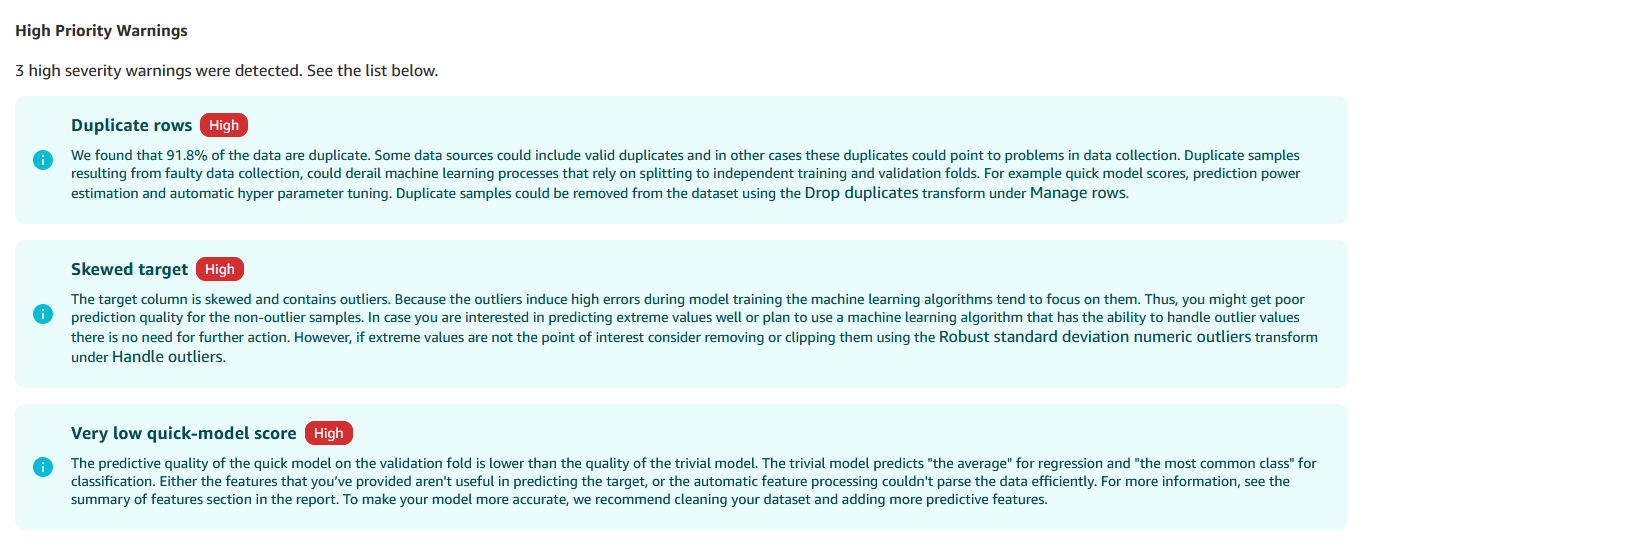
其中显示了以下问题:
-
重复行
-
偏斜的目标
重复的行会导致数据泄露,即模型在训练和测试过程中接触到相同的数据。它们会导致性能指标过于乐观。删除重复的行可确保模型在唯一的实例上进行训练,从而降低数据泄漏的风险并提高模型的泛化能力。
偏斜的目标变量分布(在本例中为票价金额列)会导致类别不平衡,在这种情况下,模型可能会偏向多数类。这可能会导致少数类的性能不佳,尤其是在需要准确预测罕见或代表性不足的实例的情况下,这就更成问题了。
解决数据质量问题
要解决这些问题并为建模准备数据集,可以搜索并应用以下转换:
-
使用管理行转换删除重复项。
-
使用稳健的标准差数值异常值处理票价金额列中的异常值。
-
使用标准差数值异常值处理行程距离和行程持续时间列中的异常值。
-
使用 Encode 分类将费率代码 ID、付款类型、额外标志和收费标志列编码为浮点数。
如果您不确定如何应用转换,请参阅 删除“year”和“hour of day”
通过解决这些数据质量问题并应用适当的转换,可以提高数据集的建模适用性。
验证数据质量和快速模型准确性
在应用转换来解决数据质量问题(例如删除重复的行)之后,我们创建了最终的数据质量和见解报告。此报告有助于验证应用的转换是否解决了问题,以及数据集现在是否处于适合建模的状态。
在查看最终的数据质量和见解报告时,您应该希望看到没有发现任何重大数据质量问题。此报告应表明:
-
目标变量不再偏斜
-
没有异常值或重复的行
此外,此报告还应根据在转换后的数据集中训练的基线模型提供快速模型分数。此分数是衡量模型潜在准确性和性能的初步指标。
按照以下过程创建数据质量和见解报告。
要创建数据质量和见解报告
-
选择删除列节点旁边的图标。
-
选择获取数据见解。
-
在分析名称中,为报告指定名称。
-
在问题类型中,选择回归。
-
在目标列中,选择票价金额。
-
在数据大小中,选择完整数据集。
-
选择创建。
将数据分成训练集和测试集
为了训练模型并评估其性能,我们使用拆分数据转换将数据分成训练集和测试集。
默认情况下, SageMaker Canvas 使用随机拆分,但您也可以使用以下类型的拆分:
-
有序
-
分层
-
按键拆分
您可以更改拆分百分比或添加拆分。
在本教程中,请使用拆分的所有默认设置。您需要双击数据集才能查看其名称。训练数据集的名称为数据集(训练)。
在顺序编码节点旁边,应用拆分数据转换。
训练模型
拆分数据之后,就可以训练模型了。此模型可从数据规律中学习。您可以用它来做出预测或发掘见解。
SageMaker Canvas 既有快速构建,也有标准构建。使用标准构建在数据上训练性能最佳的模型。
在开始训练模型之前,必须先将训练数据集导出为 SageMaker Canvas 数据集。
要导入数据集
-
在训练数据集节点旁边,选择图标并选择导出。
-
选择SageMaker 画布数据集。
-
选择导出以导出数据集。
创建数据集后,可以在已创建的 SageMaker Canvas 数据集上训练模型。有关训练模型的信息,请参阅构建自定义的数值或分类预测模型。
评估模型并做出预测
在训练完机器学习模型后,评估其性能至关重要,以确保它能满足您的要求,并在未见过的数据上表现良好。Amazon SageMaker Canvas 提供了一个用户友好的界面,用于评估模型的准确性、查看其预测并深入了解其优缺点。您可以利用这些见解,就其部署和潜在的改进领域做出明智的决策。
在部署模型之前,请使用以下步骤对其进行评估。
评估模型
-
选择我的模型。
-
选择您创建的模型。
-
在版本下,选择与模型对应的版本。
您现在可以查看模型评测指标。
对模型进行评估后,就可以对新数据进行预测。我们正在使用创建的测试数据集。
要使用测试数据集进行预测,我们需要将其转换为 SageMaker Canvas 数据集。C SageMaker anvas 数据集采用模型可以解释的格式。
使用以下步骤从测试数据集创建 SageMaker Canvas 数据集。
创建 SageMaker 画布数据集
-
在数据集(测试)数据集旁边,选择单选图标。
-
选择导出。
-
选择SageMaker 画布数据集。
-
在数据集名称中,指定数据集的名称。
-
选择导出。
使用以下步骤做出预测。它假设您仍在分析页面上。
要对测试数据集做出预测
-
选择预测。
-
选择手动。
-
选择已导出的数据集。
-
选择生成预测。
-
SageMaker Canvas 完成预测生成后,选择数据集右侧的图标。
-
选择预览以查看预测。
部署模型
评估完模型后,就可以将其部署到端点。您可以向端点提交请求,以获得预测结果。
按照以下步骤部署模型。它假设您仍在预测页面上。
要部署模型
-
选择部署。
-
选择创建部署。
-
选择部署。
清理
您已成功完成了教程。要避免产生额外费用,请删除您不使用的资源。
按照以下步骤删除您创建的端点。它假设您仍在部署页面上。
删除端点
-
选择部署右侧的单选按钮。
-
选择删除部署。
-
选择删除。
删除部署后,删除您在 C SageMaker anvas 中创建的数据集。按照以下步骤删除数据集。
要删除数据集
-
在左侧导航窗格中,选择数据集。
-
选择您已分析的数据集和用于预测的合成数据集。
-
选择删除。
为避免产生额外费用,您必须注销 SageMaker Canvas。有关更多信息,请参阅 登出亚马逊 SageMaker Canvas。